 f

the bottom of January 20 ought to hold

? but also .45 is the buy price.
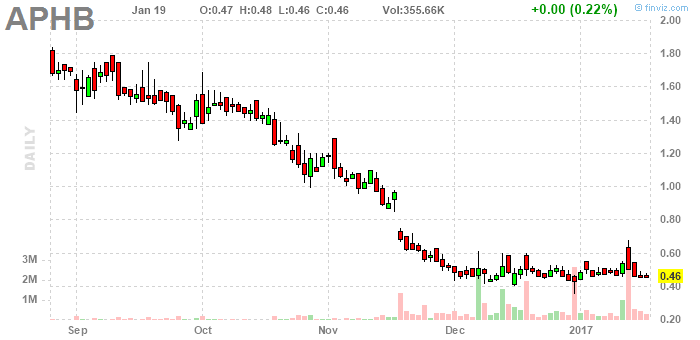
The breakout above .6 a few days ago is very positive, and since then it's been very temporal logarithmic.

It hasn't broken out of its temporal logarithm yet. Then again, at the end of the day January 18 it did break out, emphatically, from action of the last several hours. So, we can bet on the low of January 18 holding and sustained upward action now.

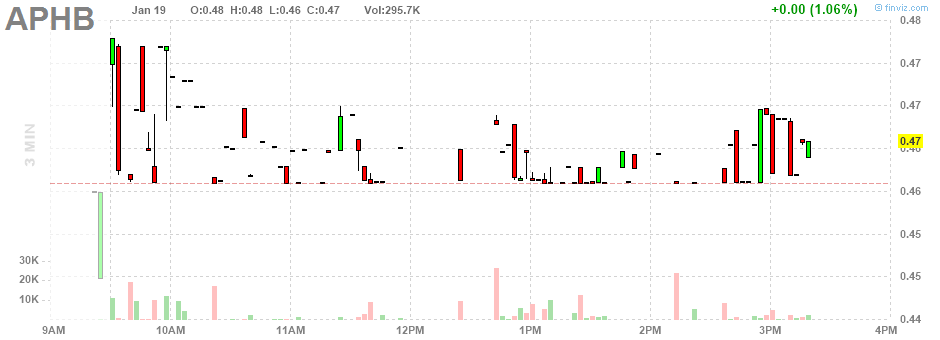
The green 15 minute bar taking shape right now is positive.

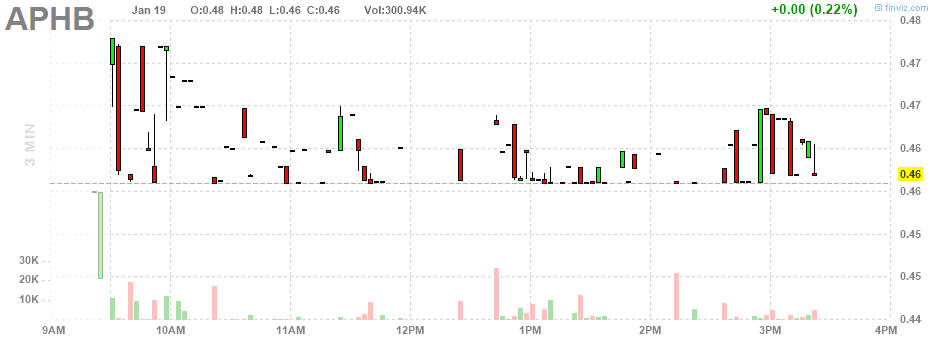
Have a laugh because now it's a red bar.

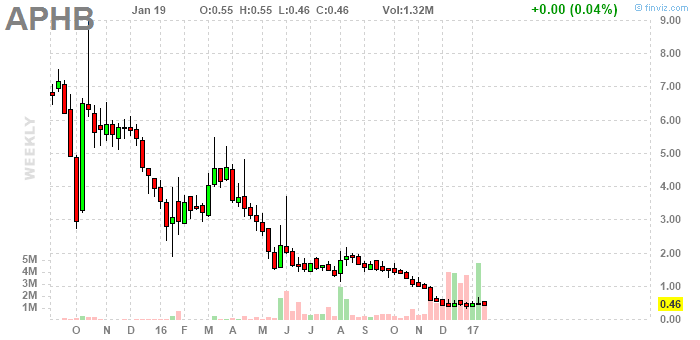
Simply inventing a theory, here, it's due for another $1 rally, answering August's, and then it'll be due for a $2 rally, then a $3 rally, and then a $6 rally, answering those of May, January through March, and last October.

Finally figured this out. According to the official Muathe method, a break above today's high, so, .475, is the entry signal.
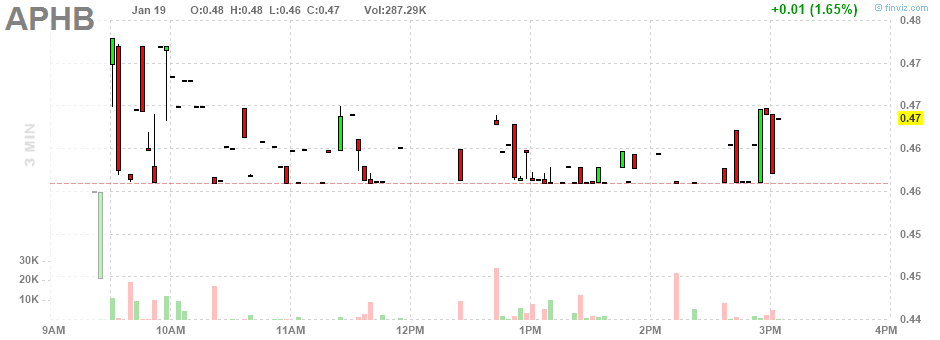
The way this looks right now a breakout above .47 would be very positive.

Here we can watch it work on that.

Bullish crossover in the hourly MACD minutes ago. (Muathe says it's bullish, but wouldn't normally be because it's below the zero line, but might still be because it's way below the previous crossover.) I also note that the histogram has crossed the zero line. Last time it did that prices surged for a bit, as you can see.

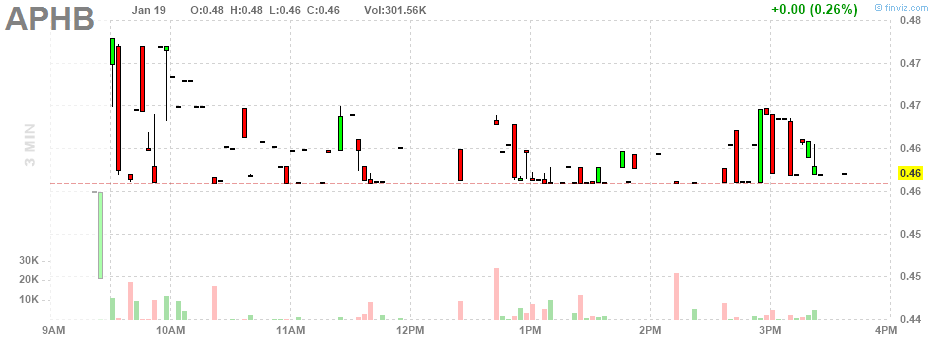
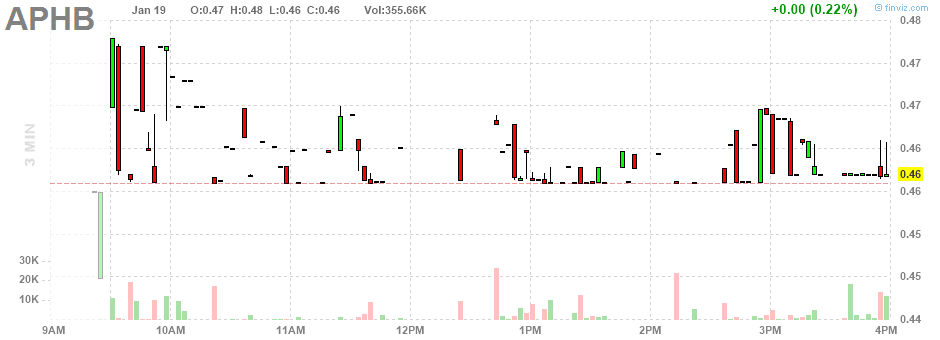
It's making higher bottoms here (on the three minute chart).

Maybe it'll travel along .461 for the rest of the day.

Nice. Temporal logarithmic on the three minute time scale, building up a higher bottom at .461.

Breakouts from a higher bottom in at the end of the day. A break above .466 is now a Muathe entry point.

I'm buying now, for the test, but an argument could be made for waiting. On the fifteen minute charts (the five day charts) the trend remains down, or, at least, hasn't turned up, and there's resistance at .54. Maybe it'll break above .5 tomorrow and then pull back and make some bottoms just under that level


 f

 f

 copied from 20170123m extra attntn almost letting this stop me out
 but have decided to trust the magnificence of that breakout.
 it's the same pattern today as I was buying yesterday.
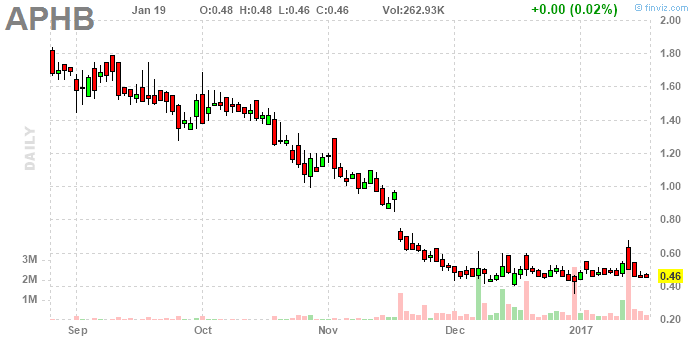
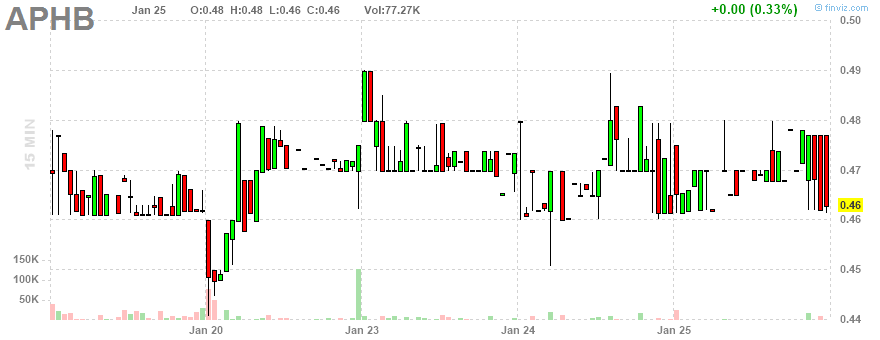 ? but also .45 is the buy price.
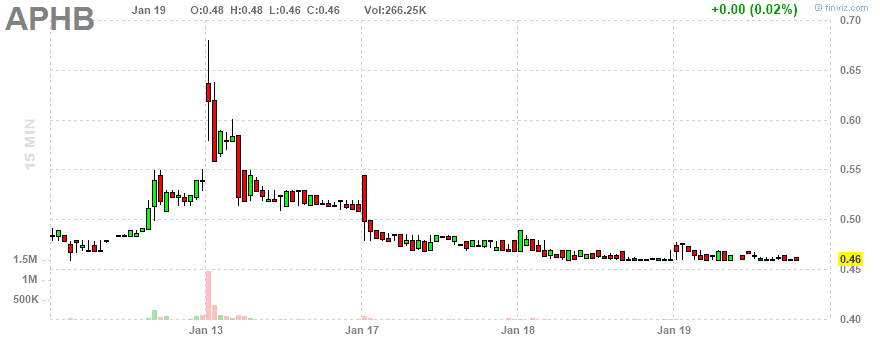

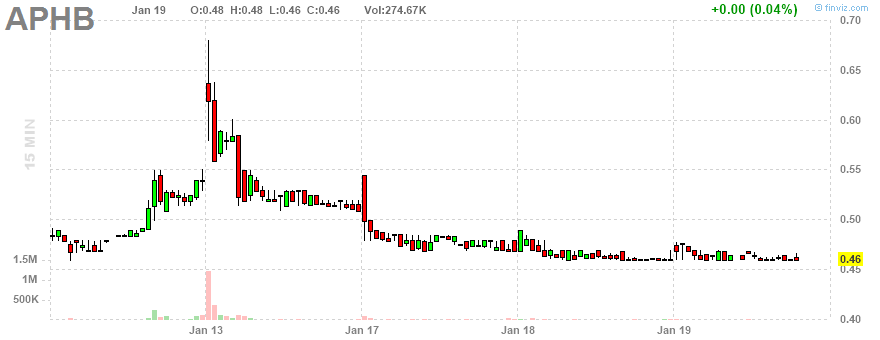

 f


 an actual break above the purple ma on this chart would be encouraging


 f y m


 Ha! within minutes of me writing the $7.10 stop was good ... betting on it ... it breaks lower! WEll, I did also say I thought I would wait a couple of days.


