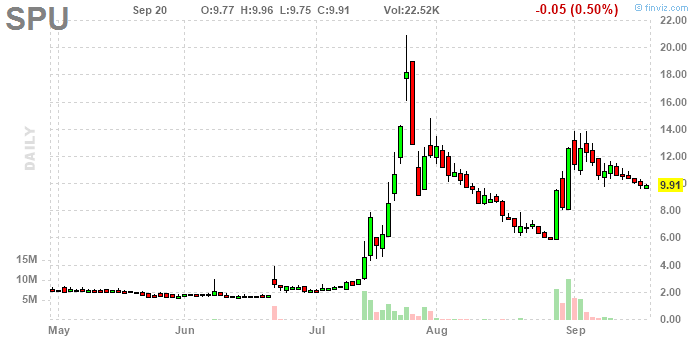
The low price in late May was 1.62. Then, a week or so into June, the price spiked above all sorts of little May tops. At the end of the day it was an inverted hammer. As an operating hypothesis we could have then said that 1.62 would be the ultimate low, meaning we could buy and limit risk with a stop at 1.61, say.
I would not have been thinking that this stop would necessarily limit risk very effectively. I would have been thinking that the price could gap down past 1.61, triggering that stop order and resulting in a sale with a loss of 25%, perhaps even 50%. And, of course, a 100% loss is always a possibility, and probably all the more so in a stock tracking sideways at very low prices, such as this one.
Another consideration: if this had broken lower after the inverted hammer, that could have been regarded as a buying opportunity, so selling, as with a stop, would have been the exact opposite of the signaled decision. Considering this, I question whether this kind of pattern lends itself to trading with stops. It seems to me to be a more defensible idea that this kind of pattern should be bought as a small enough position to justify the possibility of a complete loss, or a substantial loss, or perhaps a long wait for a recovery.
Having said that, was there in fact an indication this was about to make a very large move upward, which, of course, was the actual outcome?
Well, there was the way it had been very gradually working its way towards lower prices - and the low price itself - and there were heels in December, February, and March ... and then there was the inverted hammer a week into June itself, especially given that it broke above all those May tops. The fact that the inverted hammer's real body was up off of lower prices could be interpreted as adding weight to a bullish interpretation. Actually, I'm highlighting the chart because it supports my hypothesis that spiky moves in sideways "shallow" patterns predict big, fast moves. I don't call this a hypothesis lightly, but this is an example of the kind of chart that has led me to form the hypothesis.
So, if we interpreted the pattern as suggesting that a big move was imminent, was there any evidence as to how big the move might turn out to be?
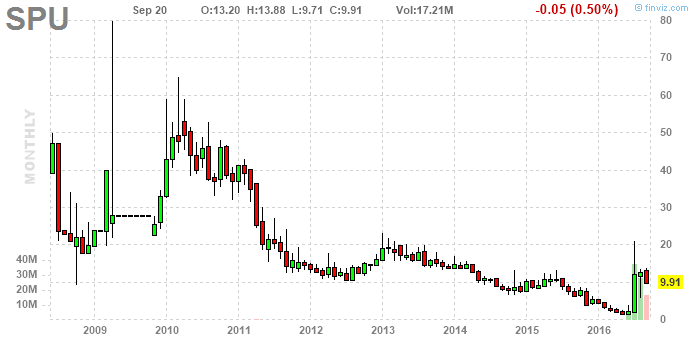
Looking at the monthly chart, any of the tops from 2013 on could have been interpreted as being a target for selling, while, in fact, as another hypothesis, the first top after a spiky and substantial top, and especially if it's part of a cluster of tops, is the likely best target. January 2013 was a prominent top, the most prominent top in the long decline beginning in 2010, and it was followed immediately by monthly bar highs at 20, and then an actual top in the monthly chart at that price ... and 20 turned out to be distinctly the top of the big move in July. Go figure.
With all that said, the 2010 top at 65 is a prominent top in this chart, and it was followed by distinct tops between 40 and 50, making a price between 40 and 50 worthy of consideration as a target given this second hypothesis.
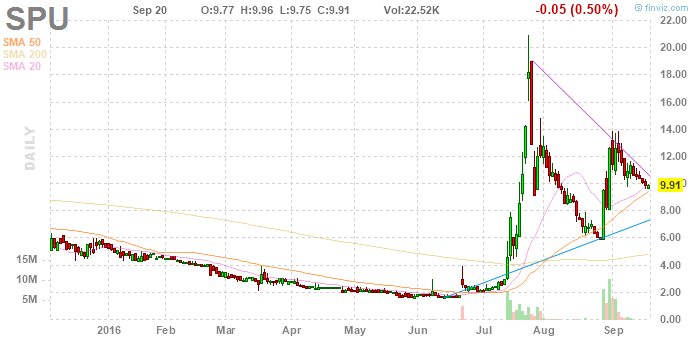
Looking at the daily charts again, of course, a sale at 20 would have been brilliant, and then the linear nature of the decline into late August would have had me on high alert, and that decline reversed emphatically at the level that was clearly "marked" by price action in mid July. And there was an inverted hammer pattern just above 6, and then a tiny bar just below 6, so there was a case for getting in at 6 on the morning of the big green bar in late August. This would have been in expectation of what, exactly? A move to 40 is, I think, the most worthwhile target, although we can see that prices reversed sharply at - rather precisely - the high price following the prominent top at the end of July! Wrapping this all up, today seems like a good moment to buy again. This means a sale at the first of August high would not have been all that advantageous, thus supporting the idea of holding on for 40+, but, make of it what you will. Two additional notes: first, SPU has quite good fundamentals. Granted, it's a Chinese company, and a friend says Chinese companies should not be trusted, but ignoring that advice could, according to this data, have produced a quite good result already, here, with the possibility of still more profits, noting, of course, that that last possibility remains strictly hypothetical. Finally, as a kind of aside, early this morning NASDAQ halted trading in SPU, explaining only that they have requested additional compliance information from the company, and trading will be halted until that information is received. Again, go figure!
Below: charts that update with the latest data when the page is loaded, and links to other charts and resources:
No comments:
Post a Comment