This big day was, in a sense, entirely predictable. I mean, I see this kind of pattern associated with sharp moves - preceding them - all the time. Sometimes I see them and think "something gonna happen," or something like that, something like "I should buy some." Granted, seeing them isn't necessarily easy, and feeling sure of them is, and should be, hard, but this is a pretty classic example. OK, so, the pattern from early November to mid December was a pick, which is a kind of wedge - I call it a pick because of its distinctive shape, which reminds me of an ice ax, or a miner's pick (which latter is poetical, dont you think?), which, I guess means it has a distinct handle on the left, and then it curves out and gets to a point. Now, I've tested picks and seen them fail. I don't remember the details, but it was enough to discourage me from relying on them. But, at the same time, they often do precede good moves, and when I say precede, I mean immediately precede.
At any rate, this pick was quite clear, and, what's more, big, which is sort of unusual - lots of picks that I see are tiny. Maybe such a big and vivid pick deserves extra consideration. Anyway, it's possible I would have been thinking about buying it as it came to a point, but the it broke out nicely. And maybe when it did that I would have been thinking about buying at the top of the breakout, too, although, I'm learning to be careful of that kind of thing (which means, only do it if you can identify a definite stop, and intend to use that stop).
Well, then it made those three red bars, and three red bars like that is a powerful signal. Now, it's true that cascades - multiple red bars in a sequence like this - can just keep on going, and just because I'm looking at a cascade doesn't mean I'm sure I should be buying ... but this was a particularly vivid cascade (in fact, maybe the pattern has a name in the candlestick iconography, three soldiers or something), and, coming off a big green bar, and bringing prices back to the boundary of a vivid pattern ... at the end of the third day of the cascade, as a trade, if you could remember this, it was pretty much a no brainer.
Now, what this means is, if your were buying it at the low of the third red bar, which, because it's a red bar with no wick was the close that day, a stop below the last bottom in the pick, so, say 16.50, was a good bet, and that would have been ... well, sort of a lot of risk, actually. 10%.
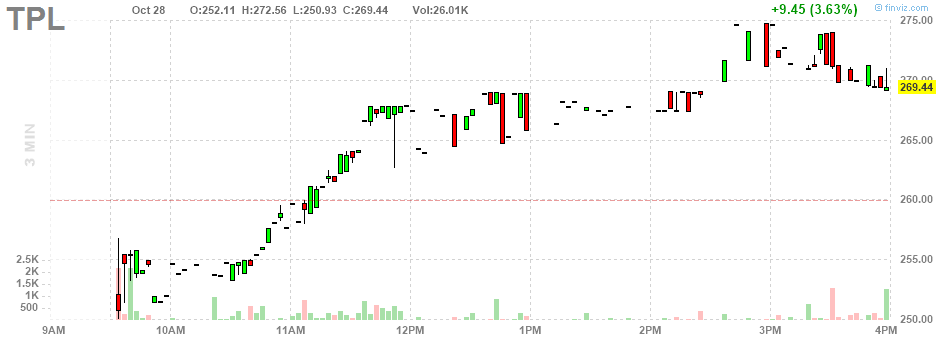
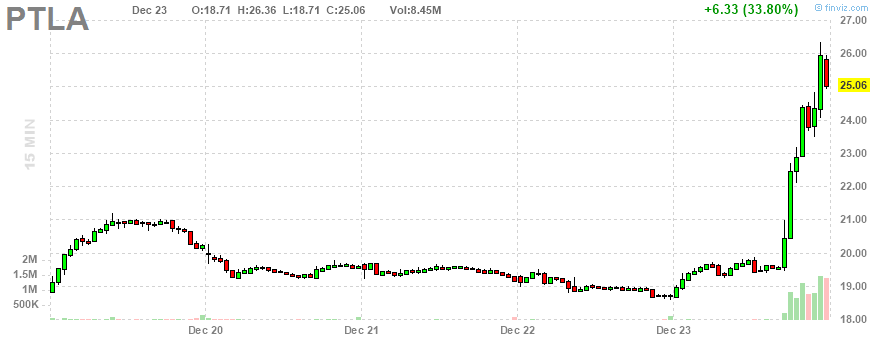
Now what I want to look at is what happened in the first hour or two of trading the next morning, because what I've seen happen is a great setup and then a great pattern for buying the next morning.<a href="http://elite.finviz.com/publish/122316/PTLAc0i3l2016.png" imageanchor="1" ><img border="0" src="http://elite.finviz.com/publish/122316/PTLAc0i3l2016.png" style="width:80px" /></a>Well, it kind of is a great pattern. It started right off with a pick, a little tiny one, if you can see that ... the first four bars. Then it broke out, and at that point it was buyable, for sure, at 19.1, or 19.2, for half an hour or so, and your stop would have been below the point of the pick, so 18.8, I guess, which is ... $1 is about 5%, and this is 1/3 of a dollar, so your risk is, say, 2%.
After that, you had a long wait, if you were watching it. You could be buying again at 11.30, if you wanted to buy more - meaning, if you wanted to buy a lot, you could have ... and why not? And then the 11.30 low became a stop, so you could have been buying at 19.6 or 19.7 between 1:30 and 2, too, with a stop at 19.2, say.
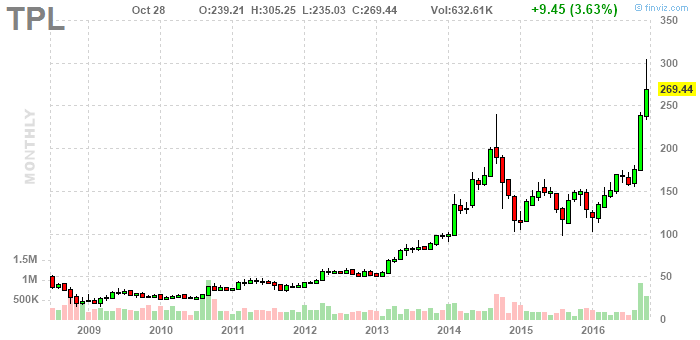
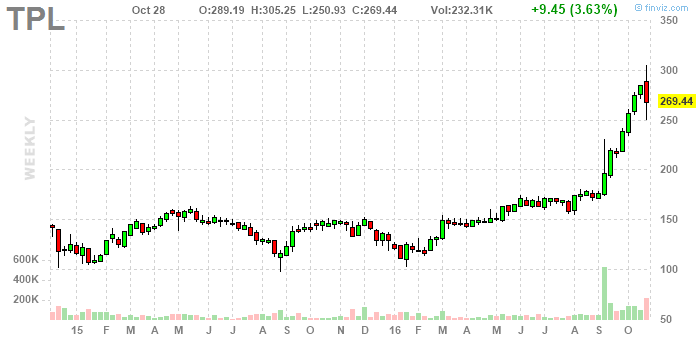
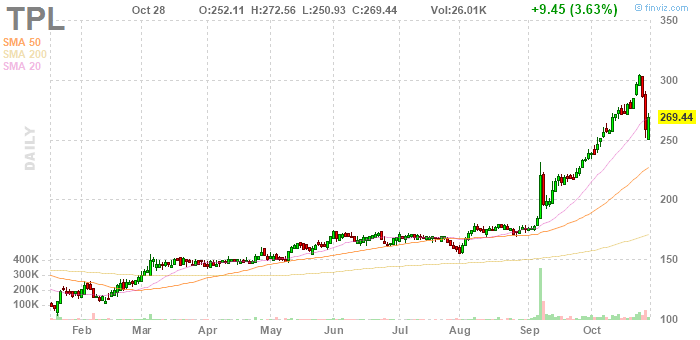
The rest, of course, is history: a 30% gain into the end of the day. The move will probably carry further ... in fact, looking at the weekly chart
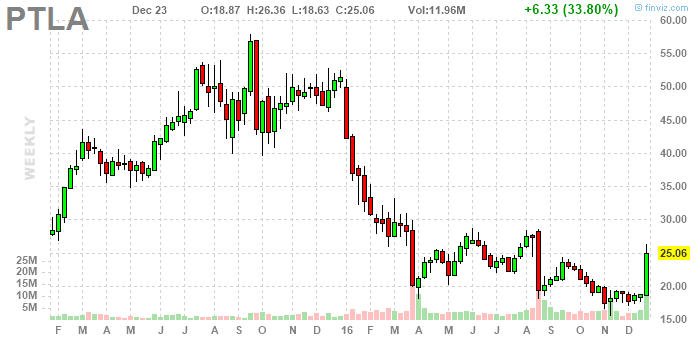 , I'd be inclined to hold it. It could go straight to $50.
f y m
The next question is, how would we have found this setup? Not too hard, I guess. It was down 20%, yesterday in six months, and we can scan for that. In fact, it was down 50% in a year, and I scan for that all the time. The only thing about that is it might not have been the kind of chart that would especially catch my eye, unless I particularly spotted that three soldiers pattern ... which I might have done. Now I have a new idea of what to look for. What this tells me is, I need to be kind of religious about running the year down 50% scan and looking at all the charts - usually several hundred of them, I guess - in order to spot this kind of opportunity. And I'm not saying that's not a challenge.
I just scanned year down 50% and then average volume over 300k, which I think PTLA would have passed, and the first chart (out of 195) is, guess what, a big pick.
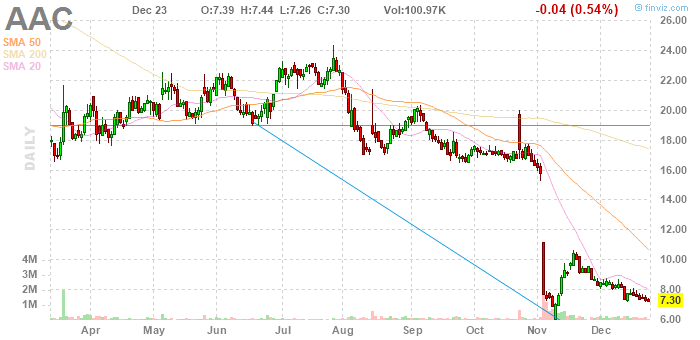 It's not the same exact kind of pick, but I was admiring it the other day ... I just wasn't quite sure what to predict. Now I'm predicting something just like what PTLA just did! By no means am I certain of this. I mean, the thing to do is to compare this chart to the one year chart for PTLA, and you can see the similarities ... particularly, in the PTLA chart, the cliff in August ... and now the AAC chart looks a lot like what PTLA looked like in, say, October, which means, in a way, it's too early to expect a move. But AAC looks a little different, to me, too. The pick handle is more pronounced, compared to PTLA from after the cliff to the top in mid September, a little, and now the pick part looks - I'm saying now that PTLA in late October and early November was a kind of pick pattern - looks, well, sharper. In fact, it ends, here, in a little pick within the pick, if you can see that.
This is the way of patterns. It's tough. It's tough to formulate absolute rules. I definitely want to see what this, AAC, is doing, Monday morning. Maybe it's a bit of a long shot, but I'm intrigued. One other thing I know: I'm not buying it without a close stop.
The plan becomes: looking for likely candidates in the scan results, then looking for good buying patterns in the morning. But there are lots of likely candidates, on any given day - as demonstrated by the scan I just ran, or any scan I run at any time - and I would want to choose a very few to look at in the morning. Turns out PTLA made a pretty distinct pattern at the close of trading that third red bar day. Since I'm studying it the very day of its breakout move, I get to record it:
 .
.
I'm wondering if I can put together a watch list to help me quickly review for the best end of day patterns.