 f y m
f y m
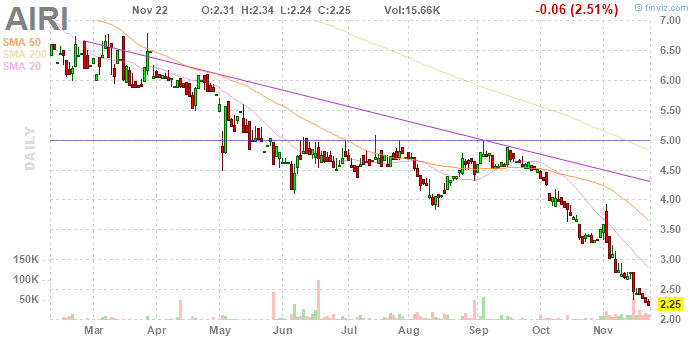
It's set up to go to 4, although it needs to get past 2.75, first, and it might make a top, there, so an afternoon sale at 2.75 makes some sense, too (for a small profit). Also, should I wait for it to turn green or something? (Paper trading this, by the way.) Well, the 15 minute chart is pretty cool.

Something like this: order 100 shares at the market, if it goes to 2.75, sell half. Is there a stop? Get out if it goes down, I guess. If it goes to 2.75 and then dips, look for a pattern to buy some more. It is very thinly traded, so this is kind of just playing around.
No comments:
Post a Comment