code
*<div id="bgi20170416esu1922chartframe">
<img id="bgi20170416esu1922chart" src="http://elite.finviz.com/publish/041617/NVETccdl22317060.png" />
<div id="bgi20170416esu1922chartcontrols">
<span onmouseover="bgi20170416esu1922('1d')">1d</span>
<span onmouseover="bgi20170416esu1922('5d')">5d</span>
<span onmouseover="bgi20170416esu1922('d')">d</span>
<span onmouseover="bgi20170416esu1922('a')">a</span>
<span onmouseover="bgi20170416esu1922('w')">w</span>
<span onmouseover="bgi20170416esu1922('m')">m</span>
</div>
</div>
<div onmouseover="bgi20170416esu1922('previous')" id="bgi20170416esu1922p">p</div>
<div onmouseover="bgi20170416esu1922('next')" id="bgi20170416esu1922n">n</div>
<style>
#bgi20170416esu1922chartframe {position:fixed;left:10%;top:20%;width:70%;height:70%;background-color:violet}
#bgi20170416esu1922chart {position:absolute;left:0%;top:0%;height:90%}
#bgi20170416esu1922chartcontrols {position:absolute;left:0%;top:90%;width:100%;height:10%}
#bgi20170416esu1922chartframe span {margin-left:30px;background-color:navajowhite;color:burlywood}
#bgi20170416esu1922p {position:fixed;left:0%;top:70%;width:10%;height:10%;background-color:greenyellow;color:pink;font-size:5em}
#bgi20170416esu1922n {position:fixed;right:0%;top:70%;width:10%;height:10%;background-color:greenyellow;color:pink;font-size:5em}
</style>
<!--<div style="position:absolute;left:50px;top:50px;width:200px;height:200px;background-color:pink"></div>-->*
Sunday, April 16, 2017
merge lists
function mergethelists() {
var list1 = document.getElementById("list1")
var list2 = document.getElementById("list2")
var lista1 = list1.innerHTML.split("*r*")
var lista2 = list2.innerHTML.split("*r*")
var newlist = document.getElementById("newlist")
var new = []
for (var i = 0; i < lista2.length; i = i + 1) {
var smbl = lista2[i]
var ison = isiton(smbl,lista1)
if (ison === "no") {new.push(smbl)}}
newlist.innerHTML = new.join('*r*')
list1.innerHTML = list1.innerHTML + "*r*" + newlist.innerHTML}
function isiton(symbol,lista) {
for (var i = 0; i < lista.length; i = i + 1) {
if (getsymbol(lista[i]) === symbol) {return "yes"}}
return "no"}
function getsymbol(record) {
return record.split(*n*)[0]}
function getnote(record) {
var recorda = record.split(*n*)
if (recorda.length === 0) {return ""}
else {return recorda[1]}}
Saturday, April 15, 2017
composer
*<div style="height: 40%; left: 0%; position: fixed; top: 30%; width: 100%;">
<textarea id="bgi20170415sa1849i" style="height: 100%; left: 0%; position: absolute; top: 0%; width: 50%;"></textarea>
<a href="javascript:bgi20170415sa1849()" style="color: greenyellow; font-size: 1.5em; left: 50%; position: absolute; top: 30%;">load code</a>
<br />
<div id="bgi20170415sa1849f" style="height: 100%; left: 0%; top: 0%; width: 100%;">
</div>
</div>
<script>
function bgi20170415sa1849() {
document.getElementById("bgi20170415sa1849f").innerHTML = document.getElementById("bgi20170415sa1849i").value}
</script>
<div style="position:absolute;left:5%;top:20%;width:200px;height:200px;font-size:100px">
<div style="position:absolute;left:0%;top:0%;width:49%;height:49%;background-color:lightgrey;color:pink;font-size:50%">u</div><div style="position:absolute;left:0%;bottom:0%;width:49%;height:49%;background-color:lightgrey;color:pink;font-size:50%">d</div><div style="position:absolute;right:0%;top:0%;width:25%;height:25%;background-color:lightgrey;color:pink;font-size:40%">f</div><div style="position:absolute;right:0%;bottom:0%;width:25%;height:25%;background-color:lightgrey;color:pink;font-size:40%">s</div><div style="position:absolute;right:0%;top:40%;background-color:white;color:pink;font-size:20%">0/1</div>
</div>
<!--<div style="position:absolute;left:50px;top:50px;width:200px;height:200px;background-color:pink"></div>-->*
Friday, April 14, 2017
play list
<img id="bgi20170414f1832c" src="" /><br />
<span id="s"></span><span id="n"></span>
<span onmouseover="('1d')"></span>
<span onmouseover="('5d')"></span>
<span onmouseover="('d')"></span>
<span onmouseover="('a')"></span>
<span onmouseover="('w')"></span>
<span onmouseover="('m')"></span>
</div>
<div id="linkpanel">
<a href="https://www.blogger.com/blogger.g?blogID=8961374960401545774" id="flink" target="_blank">f</a>
<a href="https://www.blogger.com/blogger.g?blogID=8961374960401545774" id="mlink" target="_blank">m</a>
<a href="https://www.blogger.com/blogger.g?blogID=8961374960401545774" id="ylink" target="_blank">y</a>
</div>
<div id="inputpanel">
<textarea id="bgi20170414f1832i"></textarea>
<a href="javascript:('get list')">get list</a>
<a href="javascript:('go to symbol')">go to symbol</a>
</div>
<div onmouseover="('n'">
</div>
<div onmouseover="('p')">
</div>
<script>
function bgi20170414f1832(request) {
if (request === "start") {start()}
if (request === "go to symbol") {gotosymbol()}
if (request === "1d") {i1()}
if (request === "5d") {i2()}
if (request === "d") {d()}
if (request === "a") {a()}
if (request === "w") {w()}
if (request === "m") {m()}
if (request === "n") {n()}
if (request === "p") {p()}
function putinchart(url) {document.getElementById("c").src = url}
function i1() {putinchart("http://elite.finviz.com/quote.ashx?t=" + document.getElementById("s").innerHTML + "&ty=c&ta=0&p=i3&b=1")}
function i5() {putinchart("http://elite.finviz.com/quote.ashx?t=" + document.getElementById("s").innerHTML + "&ty=c&ta=0&p=i15&b=1")}
function d() {putinchart("http://elite.finviz.com/quote.ashx?t=" + document.getElementById("s").innerHTML + "&ty=c&ta=0&p=d&b=1")}
function a() {putinchart("http://elite.finviz.com/quote.ashx?t=" + document.getElementById("s").innerHTML + "&ty=c&ta=1&p=d&b=1")}
function w() {putinchart("http://elite.finviz.com/quote.ashx?t=" + document.getElementById("s").innerHTML + "&ty=c&ta=0&p=w&b=1")}
function m() {putinchart("http://elite.finviz.com/quote.ashx?t=" + document.getElementById("s").innerHTML + "&ty=c&ta=0&p=m&b=1")}
function start() {document.getElementById("ll").innerHTML = document.getElementById("i").value.split("*s*").length;load(0)}
function load(number) {
document.getElementById("n").innerHTML = number
var r = document.getElementById("i").innerHTML.split(",")[number]
document.getElementById("s").innerHTML = r.split("*")[0]
document.getElementById("note").innerHTML = r.split("*")[1]
a()}
function next() {
var n = parseInt(document.getElementById("n").innerHTML)
var l = document.getElementById("i").value.split(",")
if (n < l.length) {load(n + 1)}}
function previous() {
var n = parseInt(document.getElementById("n").innerHTML)
var l = document.getElementById("i").value.split(",")
if (n > 0) {load(n - 1)}}
}
</script>*


Thursday, April 13, 2017
notes
Buffett picks great companies and never sells them, and he makes a lot of money. He used to pick good companies at great prices, he says, and now he picks great companies at good prices, meaning even he has evolved, but there's something else to consider: once he got up to speed on the stock market he rounded up a bunch of investors, so he was investing other people's money and had, as a result, a fair amount to start with.
adds
if you want to become quite well informed i suppose this is the book for you ... plus ... it must be a tough read, and a good one
since i want you to buy like crazy and read a lot of good stuff i'm sort of randomly picking ... things that look good to me
since i want you to buy like crazy and read a lot of good stuff i'm sort of randomly picking ... things that look good to me
aeti
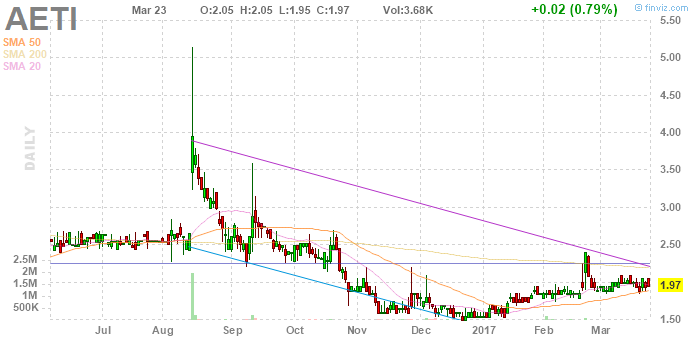
the way it's dipping is quite cool.
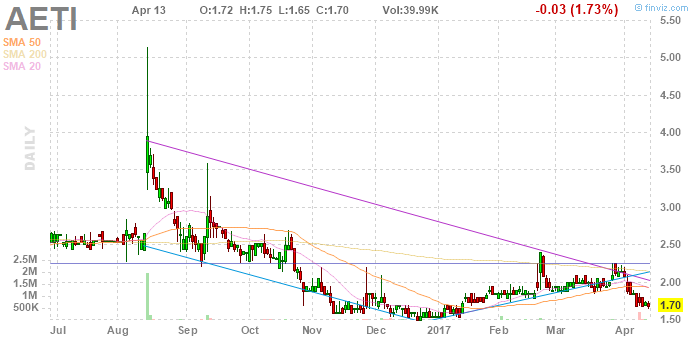 dips are often very good. it also just put in a nice four bar wedge ... from which it's dipping ... what have we been saying about wedges?? ... well, it's a buy, but if we wait we'll probably see a more definitive patter still. (presently the stop is at 1.40. also, this is entirely speculative, as a chart. i can't imagine it's got much fundamental strength ... which mean it's risky.)
agfs
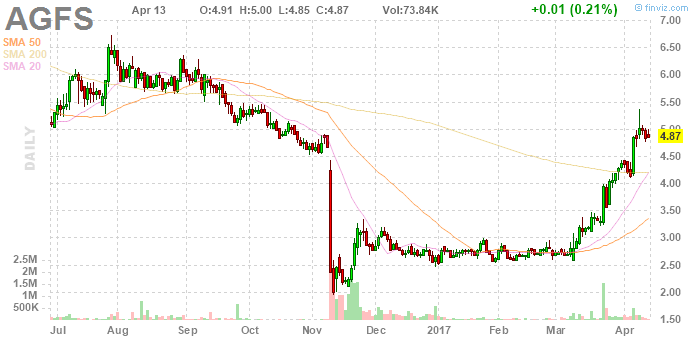
it made a loud noise, a clank, when it hit bottom there in november ... and there was a flying green bar next to a big red bar red to green a few days later ... and then a surge upward. then it of course went very sideways for months ... making lots of flying green bars, buy signals. mid february was looking good, rising bottoms, nice short bar patterns. using the bottoms as stops, 2.50 in december, 2.60 in january ... we would still be in it, maybe. then in march it made a nice short bar pattern after it started to pretty emphatically rally ... it was breaking out.
we can't sell this, yet. it would be nice to, it could dip, but this is not conclussively a top ... actually, it's a buy here ... because of the short bar ... next to the longer bar ... stop is i guess the just made low ... 4.75.
agrx
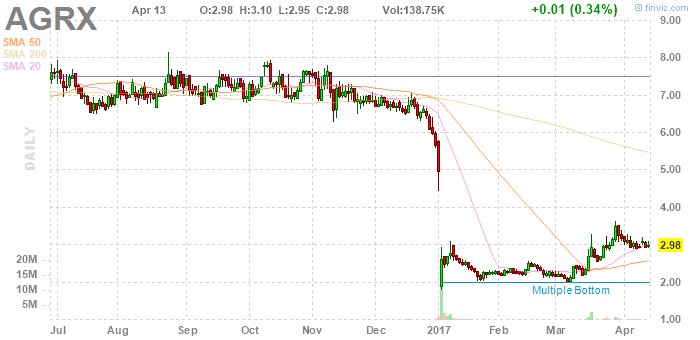
lots of flying bars in here. in a sense it's just a buy, but ... where's the stop ... you would want a stop. actually, 2.75 makes some sense ... 2.85 even ... off the little bottom in march. i guess it could jump up, here. actually, waiting some more, looking for an even better entry, is probably the thing to do. as an example, a cascade in january, ending in a two bar wedge, but obviously early and then amounting to nothing, and a wedge on a pole early in march, but it dipped, but not by a lot, and then it made a fat wedge, going red to green, therer, and since then it has rallied.
agtc
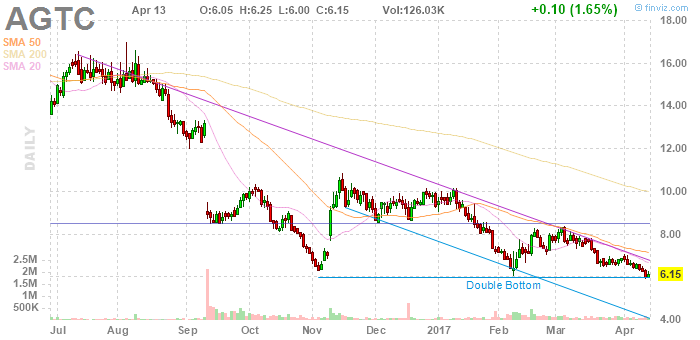
we've looked at low wedges already, and the results have been mixed or even scary, so this is iffy on that basis. i'm not ready to stop being interested. wedges are distinctive. this, though, needs to be treated as a game ... which is an iffy idea in itself ... but ... that's a buy signal, that little green candle, next to it's mom, a slightly larger red candle. the game is: treating yesterday's low as a bottom, and a stop. it could jump to 10. there are some positives in the fundamentals, though they're definitely in speculative territory.
this was cascading big time in october and then it flashed green, then rallied.
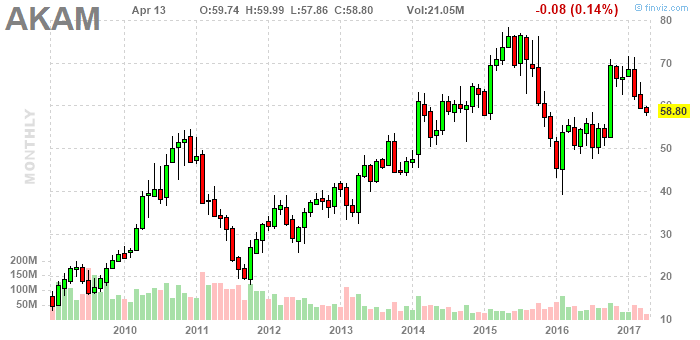
akam
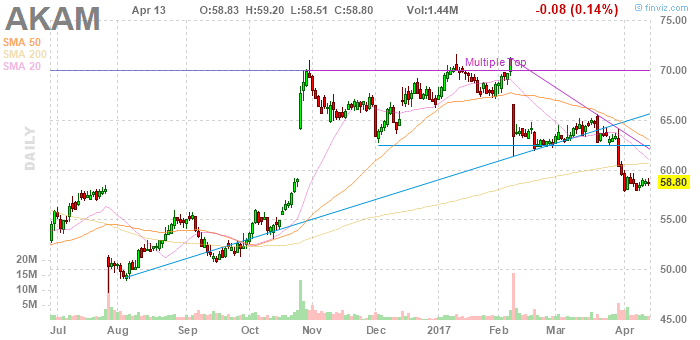
the present small point is not something to buy, though it is a focused pattern. the fundamentals pretty much check out: it's big, it steadily makes money, it's only moderately expensive relative to earnings, it's not cheap relative to book, but the balance sheet is consistent, book is positive. the monthly chart looks really good, what with the way it has just pulled back.
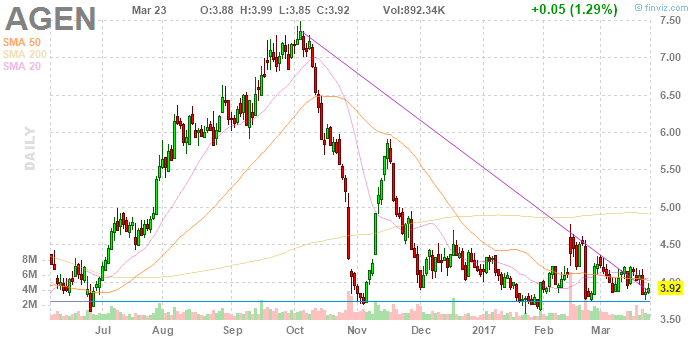
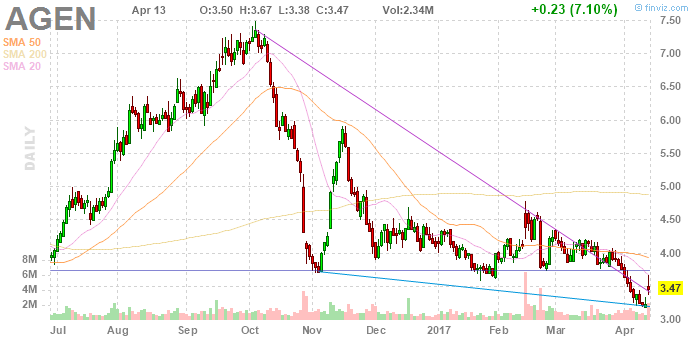
agn
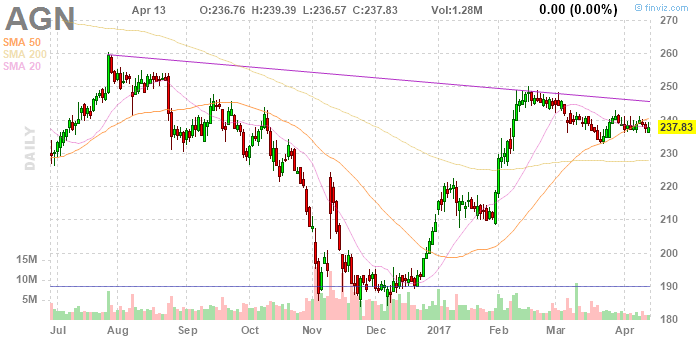
a cascade is like from mid october into november. cascades are great, but the buying patterns were a bit iffy ... i mean, that was a beautiful falling star the first day of november, after which it dipped, and though it recovered, it only recovered momentarily. a different kind of flying green bar, of a type we could pay attention to, followed a red bar green bar wedge (notably), and it was followed by a flying red bar, and then a jump, but the jump was, again, transitory. there followed another cascade, middle of november, and, after a bit, a solid rally, so a rule could be "two cascades side by side is a buy." maybe we can test that.
an entire complex of flying bars and heels ensued, culminating in ... well, first, early in december, a heel, green, fat, and next to it a flying red bar, so, green red, wedge, and a short real body, and since then it has been all up ... but then, later in december, a flying red bar next to a proud little green bar, up near the boundary of a flag and a fairly intricate head and shoulders, and after that it was entirely up.
and what about the short fat green shooting star at the top of a big green bar, right after that little red flying bar, mid late december, and all up from there? and what about the three bar wedge, red green red, end of January, in a heel and toe flag? it dipped the next morning, and then it's been all up from there. currently it's setting up for another rally, but the thing to do is wait for a really good signal, probably.
aht
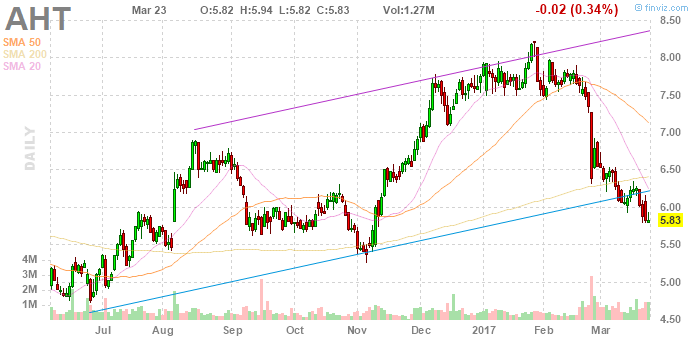
so there's the example of a descending channel at the bottom of a cliff i was thinking about. ok, it's not a huge win yet, but it's off to a good start. now it's doing an ascending wedge at the top of a cliff.
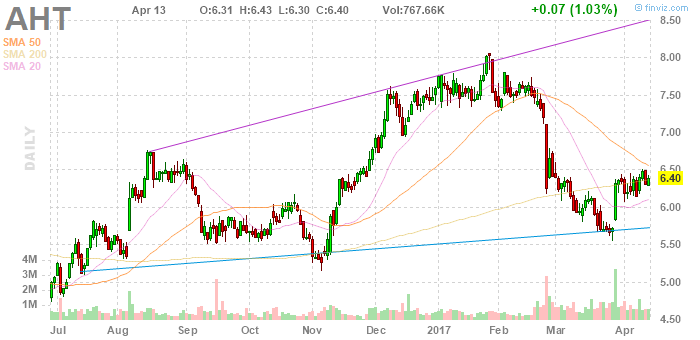
the first chart is me picking it, and i did well, this time, so far ... and it was a great pattern, descending channel at the bottom of a cliff, near an earlier bottom, and a green shooting star next to a big red bar.
aap
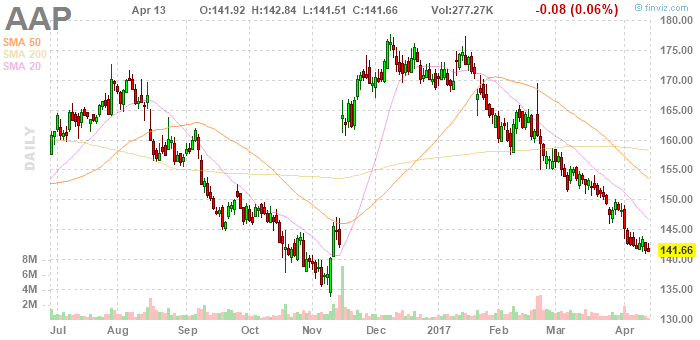
through the middle of march, from the early low to the later flying short bars (151) was a buy signal, but of the downward pointing point type, which are suspect. now in april it's a descending channel at the bottom of a cliff ... a very good pattern. the context is a descending channel since the beginning of the year ... i like descending channels. we're near an earlier low ... and look what happened after the descending channel from august to november. short bars, including flying short bars, are the buy signal. of course you can find them throughout the chart ... so ... if they're in developed channels ... like, in november ... beginning of the month ... hey, that was a descending channel at the bottom of a cliff, end of october and into november a few days. of course then you had a breakout, and a flying short bar up there, and that was followed by a pretty much instant 10% gain.
Subscribe to:
Posts (Atom)