record url: get the charts
Saturday, December 31, 2016
Tuesday, December 27, 2016
adap
Frantically writing and building lists, and trying to manage them, all day, and now, thinking "I really ought to pick a stock tonight ... but, how?" Deciding to go to the scan for Extreme Picks, and then look for ... something. Signs of an advance.
That would be ... OK, three soldiers patterns ... or I suppose any kind of bottom ... but those are a dime a dozen ... and I'm sometimes not sure how meaningful they are. Quickly scrolling through, as it turns out, a fair number of charts ... and then finding something. A gap.
Really, the gap is the signal of signals.
Wben one appears, it presages something. It's not a question of if or whether - I would go that far - but of what. At least, that's true in actively traded stocks coming out of basing patterns ... and I also mean gaps up ... although, in actively traded stocks with basing patterns, gaps down are meaningful. But gaps up ... they begin something. Sometimes that something is over, too, in the blink of an eye, but it's definitely also true that sometimes the gap is just the start of something ... something that's going to last a bit ... and be quite good.
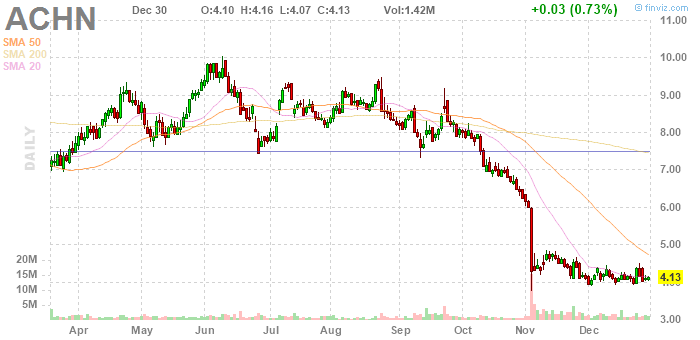
So, twenty or so stocks, and then a gap. Just nudging up. Hard to see on the chart ... but I could see it. I took a closer look, and it looks really cool.

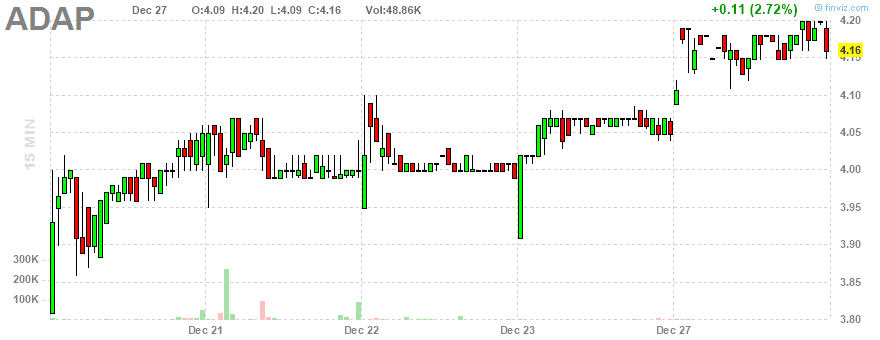
It would be a very reasonable place to buy, the bottom of a red bar, at the most microscopic scale, with a very comfortable, very close stop which is basically this morning's gap. Trading is rather placid, but it's a four dollar stock, so getting in for a few hundred shares shouldn't be a problem - or out again, if necessary. Basically 100% positive news, whether it's mind blowing or not, and a couple of good signs in the financial numbers, based on just a glance at them.
It is true we always have to consider - and certainly all the more so in a situation like this - whether the company might go into bankruptcy all of a sudden, not that it looks that way, or do a reverse split, not that it looks that way, but if one of those things happen and you have a large part of your money in this, it would be a hassle. And I don't know enough - or like it enough - to want to make a large commitment to it - I wouldn't want to, even if I could ... but I'd probably be inclined to place a bet, if I could do that.
I place the target at $7, with $9 also looking interesting, and I have a plan for updating that as the situation develops ... perhaps tomorrow, perhaps over the course of a number of days.
That would be ... OK, three soldiers patterns ... or I suppose any kind of bottom ... but those are a dime a dozen ... and I'm sometimes not sure how meaningful they are. Quickly scrolling through, as it turns out, a fair number of charts ... and then finding something. A gap.
Really, the gap is the signal of signals.
Wben one appears, it presages something. It's not a question of if or whether - I would go that far - but of what. At least, that's true in actively traded stocks coming out of basing patterns ... and I also mean gaps up ... although, in actively traded stocks with basing patterns, gaps down are meaningful. But gaps up ... they begin something. Sometimes that something is over, too, in the blink of an eye, but it's definitely also true that sometimes the gap is just the start of something ... something that's going to last a bit ... and be quite good.
So, twenty or so stocks, and then a gap. Just nudging up. Hard to see on the chart ... but I could see it. I took a closer look, and it looks really cool.
It would be a very reasonable place to buy, the bottom of a red bar, at the most microscopic scale, with a very comfortable, very close stop which is basically this morning's gap. Trading is rather placid, but it's a four dollar stock, so getting in for a few hundred shares shouldn't be a problem - or out again, if necessary. Basically 100% positive news, whether it's mind blowing or not, and a couple of good signs in the financial numbers, based on just a glance at them.
It is true we always have to consider - and certainly all the more so in a situation like this - whether the company might go into bankruptcy all of a sudden, not that it looks that way, or do a reverse split, not that it looks that way, but if one of those things happen and you have a large part of your money in this, it would be a hassle. And I don't know enough - or like it enough - to want to make a large commitment to it - I wouldn't want to, even if I could ... but I'd probably be inclined to place a bet, if I could do that.
I place the target at $7, with $9 also looking interesting, and I have a plan for updating that as the situation develops ... perhaps tomorrow, perhaps over the course of a number of days.
irg takes off
after i got done writing up the plx and cycc trades i thought I'd look for gaps, and quickly found this one.
maybe that was around 11:30. (9:30 here) i seem to remember thinking i should look for a breakout.
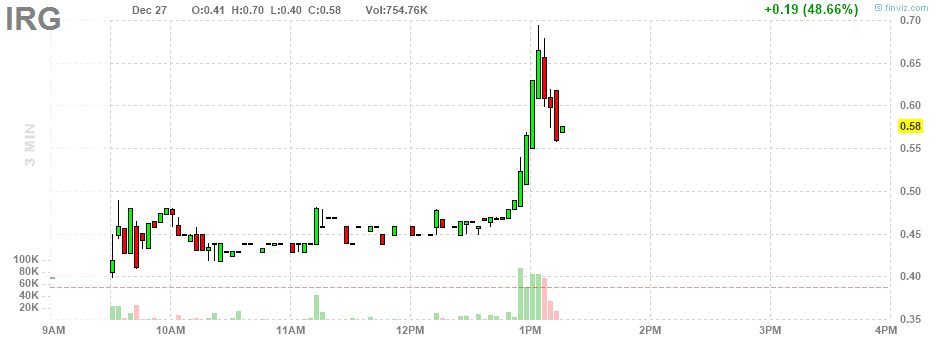
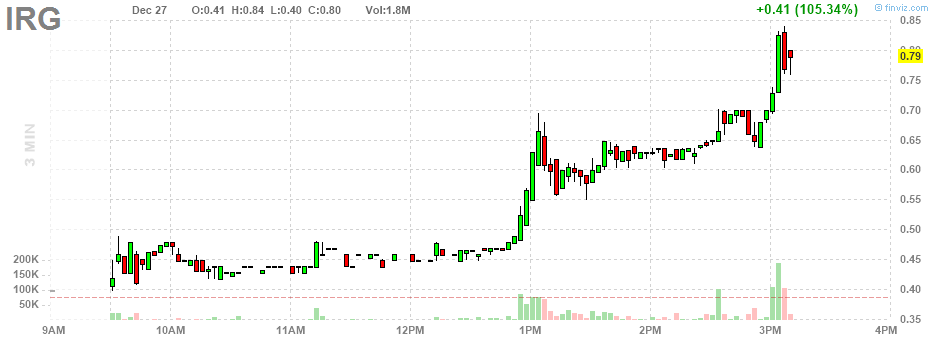
anyway, that most certainly was a breakout this morning. complete with fabulous flying inverted hammer.
well, i then got distracted. by the time i came back to it just now it had blasted off big time.
if i'd been watching from the opening bell, once that hammer was in place, i would have been (actually, really, although i'm still developing the discipline) watching for a breakout on a retracement. that came at around 10:30, in a small way, but at .43 after that would have been nice, and maybe possible, with a 2 cent stop, which is a 5% stop (which doesn't mean the risk is 5%, just that it's limited). would i have had the discipline to use a .43 limit?
it certainly broke out at 11:15, and an order at .44 after that might have been filled, and then it broke out at 12:15, and an order at .45 might have been filled, and then it broke out at 12:45, and that was really significant. i mean, we can see that in retrospect, but it was also then breaking out from a high pattern, where the previous breakouts were from low patterns. at that point, too, you had to buy at the market.

here we are a few minutes later, and elements of a top are in place. so we can consider the question of selling. well, the 1pm 3 minute bar was extended, so selling at its high would have made sense, though that's a difficult kind of decision to make. the next bar described a bit of slowing. that could have helped.
on the three minute chart, the pattern looked worrisome, once it pulled back under 60 cents, and even as it started to recover a little, but on the fifteen minute chart it actually looked solid to go back to .70. since i had that thought it has been rallying again.
tempting to sell at .65, here. that's a good gain. (should sell at that price if i chose to do it).
hesitating, though. the inverted hammer, and then the way it's surging from .55 makes me think, first, that it's going to .7, and then it makes me think i should check the longer term for clues as to where this is headed.
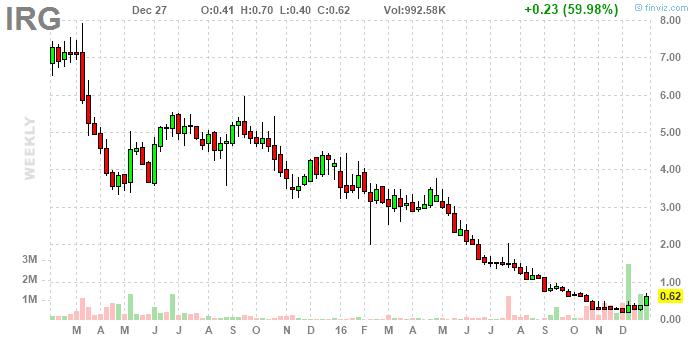
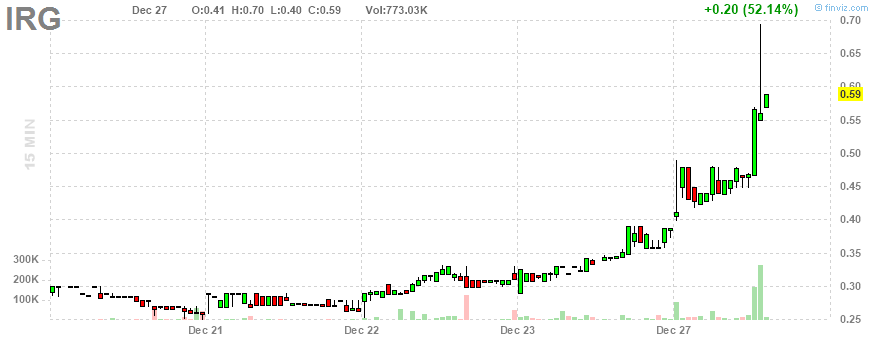
the weekly chart particularly makes me think this is not done. seriously considering holding it overnight. kind of expect another gap up tomorrow morning. even if it drops, i'll probably be able to sell it at .6 still, tomorrow afternoon, say.
Watchlist Notes
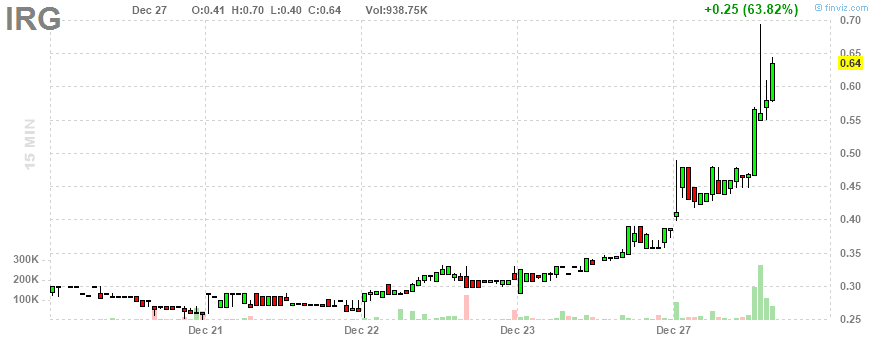
I found this this morning, looking at stocks up a bunch, so that's one way for sure, but it worries me a little. I mean, it shouldn't - this is great - but what if I could have had it on a top level watch list several days ago? On what basis? On the basis of its being a nice pick, and having returned to the top of early December's nifty boat shaped bottom ("deck","hull"). The question then is, if it was on an "extra watch" list, what was the actual buy signal, and the five day chart we have maybe just covers the relevant details.
It broke out, above tops, well, shelves, anyway, the morning of December 21, though not in a completely convincing fashion. True, the December 20 end of day lows, a nifty double bottom, turned out to be the reversal price, but what was there in the way of a stop? Was that nifty double bottom the stop? Then, first thing December 22 it sent down a scary tail to the stop level, but bounced right back, then broke out strongly through the middle of the day, then pulled back into nice horizontality, and even broke out at the close (which reminds me, I want to look for breakouts at the close as a way to pick trades for the next morning). But where was the stop then? Under the morning's action. But the morning of the 23rd, it shot down there. Still, it immediately began climbing.
All these signals, though, were neutral or even a bit negative, contextually. The first signal that was entirely positive was the solid green 15 minute bar mid day the 23rd. Really, it broke above all sorts of tops. The stop, at that point - and this is sort of a not to self, as much as saying I knew this - was any bottom, so, the low of the breakout bar, and even each subsequent low until the nest breakout, an hour or two later.
Finally, a nifty little base formed near the close, with a stop below the low of the day's second big green bar, and then the last bar broke out from that base, and the base held as a stop. We've already seen what happened today, after that.
Final Question
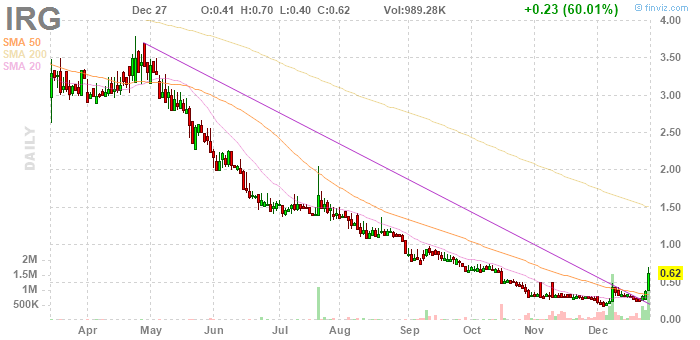
What about a target. What would I have been thinking about as that pick formed up on the daily chart? Well, the action of July and August was telling, and I would have noticed it. I'm not saying I would have said it was a certitude it was headed up there, or that I am saying it is now, but I would have thought it was a possibility ... and I still do.
back to trading

another buying pattern. is this setting up an afternoon rally? stop is .625. could move my stop up there on the earlier buys and be pretty happy (but, a little anxious ... i described the alternative already: wait until tomorrow to sell either way ... thus, now, not risking getting stopped out on a silly premature raised stop).
Notes on Trading
Let's say I had $2000 in cash available for trading. I want to use a close stop, so I might get stopped out any time, including with in minutes, and definitely within a couple of days, which would be before my purchase cleared, so I would have to have cash in the account to cover a sale - I've learned that the hard way. This means the maximum I can put into a trade of this sort is half the cash available for trading in my account, and if that's $1000, then the commission on a round turn represents 1.5% of risk, by itself. Add to that the risk in each trade, and we've been looking at 5% of risk, here, even with our very close stops.
This basically means, with a very small account, we have one shot at this kind trade. Either that or our commissions become an increasingly major factor, and our risk starts to creep up towards the 10 and 20% are, or higher.
I do feel good about the later analysis, presented here, where we were looking at breakouts on top of breakouts. (Does the last proposed buy qualify?)
setting up a buying pattern again.
maybe that was around 11:30. (9:30 here) i seem to remember thinking i should look for a breakout.
anyway, that most certainly was a breakout this morning. complete with fabulous flying inverted hammer.
well, i then got distracted. by the time i came back to it just now it had blasted off big time.
if i'd been watching from the opening bell, once that hammer was in place, i would have been (actually, really, although i'm still developing the discipline) watching for a breakout on a retracement. that came at around 10:30, in a small way, but at .43 after that would have been nice, and maybe possible, with a 2 cent stop, which is a 5% stop (which doesn't mean the risk is 5%, just that it's limited). would i have had the discipline to use a .43 limit?
it certainly broke out at 11:15, and an order at .44 after that might have been filled, and then it broke out at 12:15, and an order at .45 might have been filled, and then it broke out at 12:45, and that was really significant. i mean, we can see that in retrospect, but it was also then breaking out from a high pattern, where the previous breakouts were from low patterns. at that point, too, you had to buy at the market.
here we are a few minutes later, and elements of a top are in place. so we can consider the question of selling. well, the 1pm 3 minute bar was extended, so selling at its high would have made sense, though that's a difficult kind of decision to make. the next bar described a bit of slowing. that could have helped.
on the three minute chart, the pattern looked worrisome, once it pulled back under 60 cents, and even as it started to recover a little, but on the fifteen minute chart it actually looked solid to go back to .70. since i had that thought it has been rallying again.
tempting to sell at .65, here. that's a good gain. (should sell at that price if i chose to do it).
hesitating, though. the inverted hammer, and then the way it's surging from .55 makes me think, first, that it's going to .7, and then it makes me think i should check the longer term for clues as to where this is headed.
the weekly chart particularly makes me think this is not done. seriously considering holding it overnight. kind of expect another gap up tomorrow morning. even if it drops, i'll probably be able to sell it at .6 still, tomorrow afternoon, say.
Watchlist Notes
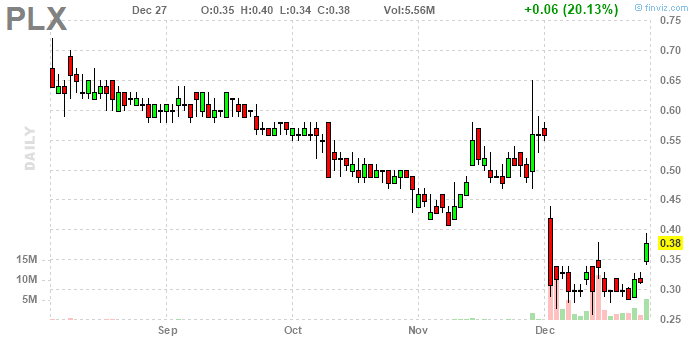
I found this this morning, looking at stocks up a bunch, so that's one way for sure, but it worries me a little. I mean, it shouldn't - this is great - but what if I could have had it on a top level watch list several days ago? On what basis? On the basis of its being a nice pick, and having returned to the top of early December's nifty boat shaped bottom ("deck","hull"). The question then is, if it was on an "extra watch" list, what was the actual buy signal, and the five day chart we have maybe just covers the relevant details.
It broke out, above tops, well, shelves, anyway, the morning of December 21, though not in a completely convincing fashion. True, the December 20 end of day lows, a nifty double bottom, turned out to be the reversal price, but what was there in the way of a stop? Was that nifty double bottom the stop? Then, first thing December 22 it sent down a scary tail to the stop level, but bounced right back, then broke out strongly through the middle of the day, then pulled back into nice horizontality, and even broke out at the close (which reminds me, I want to look for breakouts at the close as a way to pick trades for the next morning). But where was the stop then? Under the morning's action. But the morning of the 23rd, it shot down there. Still, it immediately began climbing.
All these signals, though, were neutral or even a bit negative, contextually. The first signal that was entirely positive was the solid green 15 minute bar mid day the 23rd. Really, it broke above all sorts of tops. The stop, at that point - and this is sort of a not to self, as much as saying I knew this - was any bottom, so, the low of the breakout bar, and even each subsequent low until the nest breakout, an hour or two later.
Finally, a nifty little base formed near the close, with a stop below the low of the day's second big green bar, and then the last bar broke out from that base, and the base held as a stop. We've already seen what happened today, after that.
Final Question
What about a target. What would I have been thinking about as that pick formed up on the daily chart? Well, the action of July and August was telling, and I would have noticed it. I'm not saying I would have said it was a certitude it was headed up there, or that I am saying it is now, but I would have thought it was a possibility ... and I still do.
back to trading
another buying pattern. is this setting up an afternoon rally? stop is .625. could move my stop up there on the earlier buys and be pretty happy (but, a little anxious ... i described the alternative already: wait until tomorrow to sell either way ... thus, now, not risking getting stopped out on a silly premature raised stop).
Notes on Trading
Let's say I had $2000 in cash available for trading. I want to use a close stop, so I might get stopped out any time, including with in minutes, and definitely within a couple of days, which would be before my purchase cleared, so I would have to have cash in the account to cover a sale - I've learned that the hard way. This means the maximum I can put into a trade of this sort is half the cash available for trading in my account, and if that's $1000, then the commission on a round turn represents 1.5% of risk, by itself. Add to that the risk in each trade, and we've been looking at 5% of risk, here, even with our very close stops.
This basically means, with a very small account, we have one shot at this kind trade. Either that or our commissions become an increasingly major factor, and our risk starts to creep up towards the 10 and 20% are, or higher.
I do feel good about the later analysis, presented here, where we were looking at breakouts on top of breakouts. (Does the last proposed buy qualify?)
setting up a buying pattern again.
cycc ideal day trade
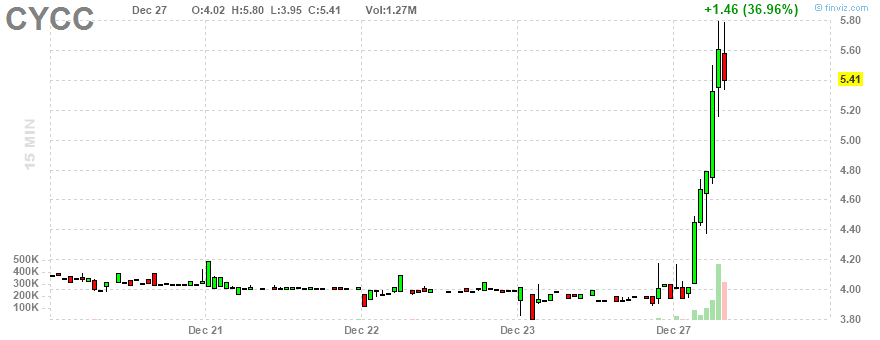
up 20% in the first couple of hours. now that's what I want!
what can I look for to clue me in to something like this?
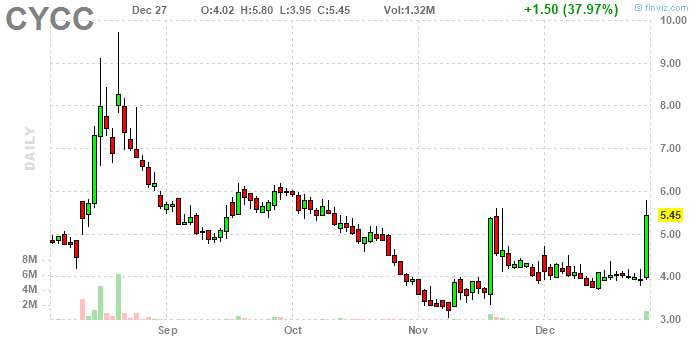
on the daily, down 50% in 6 months, a nice pick into mid month, then a nice flying wedge double bottom, all capped off by a dragonfly candle. OK.
and, on the five day chart, a strong dip first thing, complete with rebound into what built into a great looking horizontal pick into the afternoon, and then a spiky breakout (big wave) to cap it all off.

in the morning, we want to buy a breakout. it builds a nice wedge into 10am, 10:15, two tiny bars for a point low, and then gaps up, so that's the signal. buy at the market there? 4c is 1%, so it's a 3% stop right up to 4.10, treating the just mentioned gap as the stop level. the top at 5.50 was a good sell signal, completing an s shaped rally with a runout second leg.
plx paperttrade
 gonna try to buy it now (paper trading) ... but I need a closer stop
earlier it corrected at .36 and then was just available at that price. .35 would then have been a 3% stop.

It's 8:40 here, 10:40 in New York. I need to start watching at 7:30.
OK, I see it: .365 is the stop.
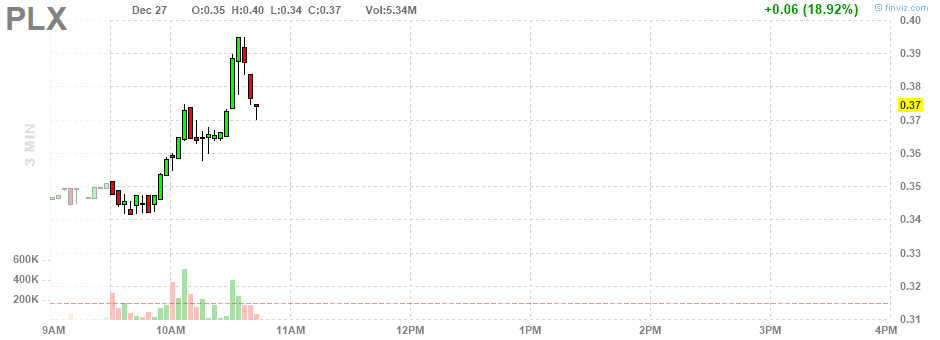 place order at .370
 with luck it's headed to .55 today
 OK, I own it. .3675 would have filled too ... I could be adding a position, given sufficient funds. Gonna take a little break, here.
\
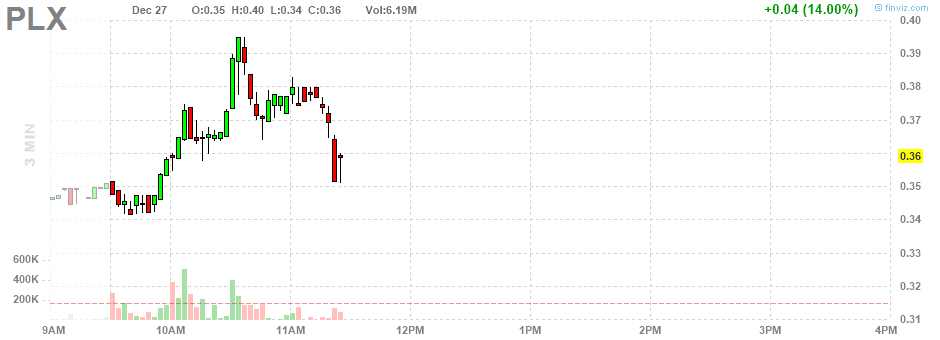 whoops ... stopped out
.347 is the next buy price. I could try being more patient, though.
Monday, December 26, 2016
list switcher
*list*base*name**list*extreme_base*name**list*eb_with_volume*name**list*eb_up*name**list*ebv_up*name*
getting blogger charts
periodsymbols = "m,w,d,i15,i3"
function getdynochartset(symbol) {}
function getchart(url,width) {
var code = '<a href="' + url + '" imageanchor="1"><img src="'
return code + url + '" style="width:' + width + 'px" /></a>'}
function getdynocharturl(period,symbol) {
var base = 'http://elite.finviz.com/chart.ashx?t='
var base2 = '&ty=c&ta=0&p=';var top = '&s=l'
return base + symbol + base2 + period + top}
Friday, December 23, 2016
ptla
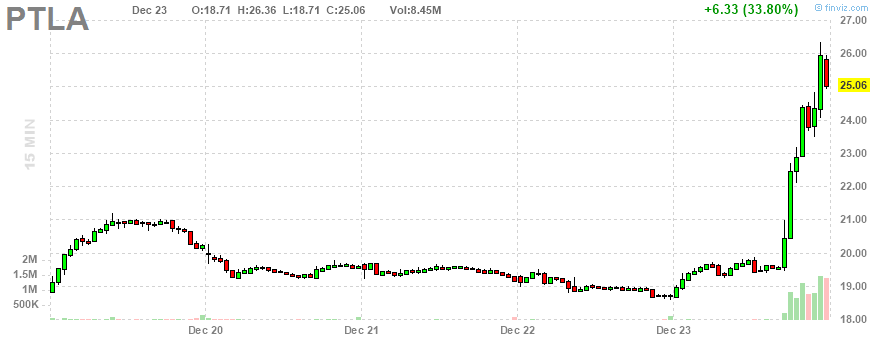
 This big day was, in a sense, entirely predictable. I mean, I see this kind of pattern associated with sharp moves - preceding them - all the time. Sometimes I see them and think "something gonna happen," or something like that, something like "I should buy some." Granted, seeing them isn't necessarily easy, and feeling sure of them is, and should be, hard, but this is a pretty classic example. OK, so, the pattern from early November to mid December was a pick, which is a kind of wedge - I call it a pick because of its distinctive shape, which reminds me of an ice ax, or a miner's pick (which latter is poetical, dont you think?), which, I guess means it has a distinct handle on the left, and then it curves out and gets to a point. Now, I've tested picks and seen them fail. I don't remember the details, but it was enough to discourage me from relying on them. But, at the same time, they often do precede good moves, and when I say precede, I mean immediately precede.
At any rate, this pick was quite clear, and, what's more, big, which is sort of unusual - lots of picks that I see are tiny. Maybe such a big and vivid pick deserves extra consideration. Anyway, it's possible I would have been thinking about buying it as it came to a point, but the it broke out nicely. And maybe when it did that I would have been thinking about buying at the top of the breakout, too, although, I'm learning to be careful of that kind of thing (which means, only do it if you can identify a definite stop, and intend to use that stop).
Well, then it made those three red bars, and three red bars like that is a powerful signal. Now, it's true that cascades - multiple red bars in a sequence like this - can just keep on going, and just because I'm looking at a cascade doesn't mean I'm sure I should be buying ... but this was a particularly vivid cascade (in fact, maybe the pattern has a name in the candlestick iconography, three soldiers or something), and, coming off a big green bar, and bringing prices back to the boundary of a vivid pattern ... at the end of the third day of the cascade, as a trade, if you could remember this, it was pretty much a no brainer.
Now, what this means is, if your were buying it at the low of the third red bar, which, because it's a red bar with no wick was the close that day, a stop below the last bottom in the pick, so, say 16.50, was a good bet, and that would have been ... well, sort of a lot of risk, actually. 10%.
Now what I want to look at is what happened in the first hour or two of trading the next morning, because what I've seen happen is a great setup and then a great pattern for buying the next morning.<a href="http://elite.finviz.com/publish/122316/PTLAc0i3l2016.png" imageanchor="1" ><img border="0" src="http://elite.finviz.com/publish/122316/PTLAc0i3l2016.png" style="width:80px" /></a>Well, it kind of is a great pattern. It started right off with a pick, a little tiny one, if you can see that ... the first four bars. Then it broke out, and at that point it was buyable, for sure, at 19.1, or 19.2, for half an hour or so, and your stop would have been below the point of the pick, so 18.8, I guess, which is ... $1 is about 5%, and this is 1/3 of a dollar, so your risk is, say, 2%.
After that, you had a long wait, if you were watching it. You could be buying again at 11.30, if you wanted to buy more - meaning, if you wanted to buy a lot, you could have ... and why not? And then the 11.30 low became a stop, so you could have been buying at 19.6 or 19.7 between 1:30 and 2, too, with a stop at 19.2, say.
The rest, of course, is history: a 30% gain into the end of the day. The move will probably carry further ... in fact, looking at the weekly chart
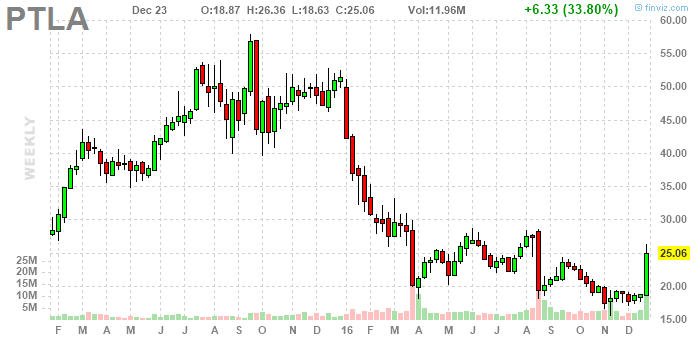 , I'd be inclined to hold it. It could go straight to $50.
f y m
The next question is, how would we have found this setup? Not too hard, I guess. It was down 20%, yesterday in six months, and we can scan for that. In fact, it was down 50% in a year, and I scan for that all the time. The only thing about that is it might not have been the kind of chart that would especially catch my eye, unless I particularly spotted that three soldiers pattern ... which I might have done. Now I have a new idea of what to look for. What this tells me is, I need to be kind of religious about running the year down 50% scan and looking at all the charts - usually several hundred of them, I guess - in order to spot this kind of opportunity. And I'm not saying that's not a challenge.
I just scanned year down 50% and then average volume over 300k, which I think PTLA would have passed, and the first chart (out of 195) is, guess what, a big pick.
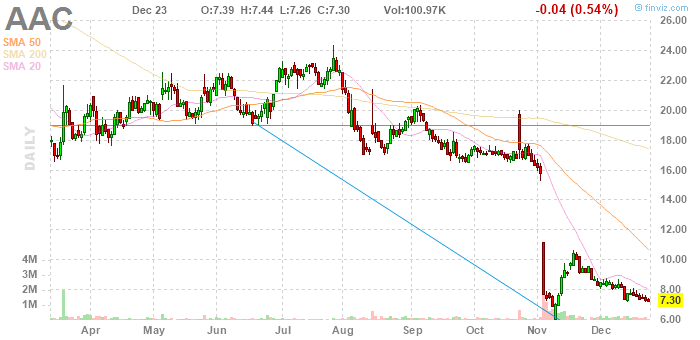 It's not the same exact kind of pick, but I was admiring it the other day ... I just wasn't quite sure what to predict. Now I'm predicting something just like what PTLA just did! By no means am I certain of this. I mean, the thing to do is to compare this chart to the one year chart for PTLA, and you can see the similarities ... particularly, in the PTLA chart, the cliff in August ... and now the AAC chart looks a lot like what PTLA looked like in, say, October, which means, in a way, it's too early to expect a move. But AAC looks a little different, to me, too. The pick handle is more pronounced, compared to PTLA from after the cliff to the top in mid September, a little, and now the pick part looks - I'm saying now that PTLA in late October and early November was a kind of pick pattern - looks, well, sharper. In fact, it ends, here, in a little pick within the pick, if you can see that.
This is the way of patterns. It's tough. It's tough to formulate absolute rules. I definitely want to see what this, AAC, is doing, Monday morning. Maybe it's a bit of a long shot, but I'm intrigued. One other thing I know: I'm not buying it without a close stop.
The plan becomes: looking for likely candidates in the scan results, then looking for good buying patterns in the morning. But there are lots of likely candidates, on any given day - as demonstrated by the scan I just ran, or any scan I run at any time - and I would want to choose a very few to look at in the morning. Turns out PTLA made a pretty distinct pattern at the close of trading that third red bar day. Since I'm studying it the very day of its breakout move, I get to record it:
 .
.
I'm wondering if I can put together a watch list to help me quickly review for the best end of day patterns.
yeco
f y m
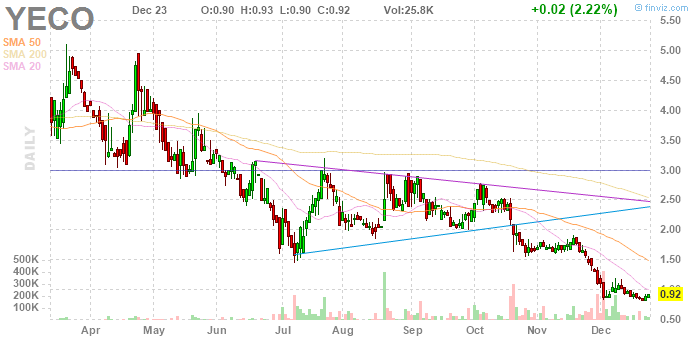
 On paper buying one or two hundred shares at ... uh ... $.91, with a stop at $.89. Why These Two Stocks Have Been Catching Shade From NASDAQ is where I got the idea.
create motioncontrols
function createmotioncontrols(namespace) {
var controlpanel = document.createElement("div")
window.document.body.appendChild(controlpanel)
var id = document.createAttribute("id")
controlpanel.setAttributeNode(id)
id.value = namespace + "motioncontrolpanel"
var style = document.createAttribute("style")
controlpanel.setAttributeNode(style)
style.value = "position:fixed;left:" + (window.innerWidth * .05) + "px"
var height = window.innerHeight * .5
style.value = style.value + ";top:" + (window.innerHeight * .3) + "px"
var width = height / 11
style.value = style.value + ";width:" + width + "px"
style.value = style.value + ";height:" + height + "px"
style.value = style.value + ";font-size:" + height + "px"
createreadout("whattomove",1,controlpanel,"",namespace,width,"selectwhattomove")
function createreadout(thisid,position,controlpanel,value,namespace,width,action) {
var frame = document.createElement("div")
controlpanel.appendChild(frame)
var style = document.createAttribute("style")
frame.setAttributeNode(style)
style.value = "position:absolute;left:0px;bottom:" + ((position - 1) * width) + "px"
style.value = style.value + ";width:" + width + "px"
style.value = style.value + ";height:" + width + "px"
style.value = style.value + ";font-size:" + width + "px"
if (action === "") {
var readout = document.createElement("div")}
else {
var readout = document.createElement("a")
var href = document.createAttribute("href")
readout.setAttributeNode(href)
href.value = "javascript:" + namespace + "(" + action + ")"}
frame.appendChild(readout)
var id = document.createAttribute("id")
readout.setAttributeNode(id)
id.value = namespace + thisid
var style = document.createAttribute("style")
readout.setAttributeNode(style)
style.value = "postion:absolute;left:0%;bottom:0%;width:90%;height:90%"
style.value = style.value + ";font-size:90%;color:greenyellow"
readout.appendChild(document.createTextNode(value))}
// createreadout(thisid,position,controlpanel,value,namespace,width,action)
createreadout("motion",2,controlpanel,0,namespace,width,"")
var buttons = "-,minus;+,plus;d,down;u,up;r,right;l,left".split(";")
for (var i = 0; i < buttons.length; i = i + 1) {
var label = buttons[i].split(",")[0]
var action = namespace + '("' + buttons[i].split(",")[1] + '")'
createbutton(label,action,i,controlpanel,width)}
function createbutton(label,thisaction,position,controlpanel,width) {
var buttonframe = document.createElement("div")
controlpanel.appendChild(buttonframe)
var style = document.createAttribute("style")
buttonframe.setAttributeNode(style)
style.value = "position:absolute;left:0px;bottom:" + ((position + 2) * width) + "px"
style.value = style.value + ";width:" + width + "px"
style.value = style.value + ";height:" + width + "px"
style.value = style.value + ";font-size:" + width + "px"
var button = document.createElement("div")
buttonframe.appendChild(button)
var style = document.createAttribute("style")
button.setAttributeNode(style)
style.value = "postion:absolute;left:0%;bottom:0%;width:90%;height:90%"
style.value = style.value + ";font-size:90%;color:pink;background-color:lightgrey"
var action = document.createAttribute("onmouseover")
button.setAttributeNode(action)
action.value = namespace + '("' + thisaction + '")'
var stop = document.createAttribute("onmouseout")
button.setAttributeNode(stop)
stop.value = namespace + '("stop")'
button.appendChild(document.createTextNode(label)}
// createbutton(label,thisaction,position,controlpanel,width)
createbutton("s","slower",8,controlpanel,width)
// createreadout(thisid,position,controlpanel,value,namespace,width,action)
createreadout("speed",9,controlpanel,1,namespace,width,"")
createbutton("s","slower",10,controlpanel,width)}
Thursday, December 22, 2016
Subscribe to:
Posts (Atom)