f y m
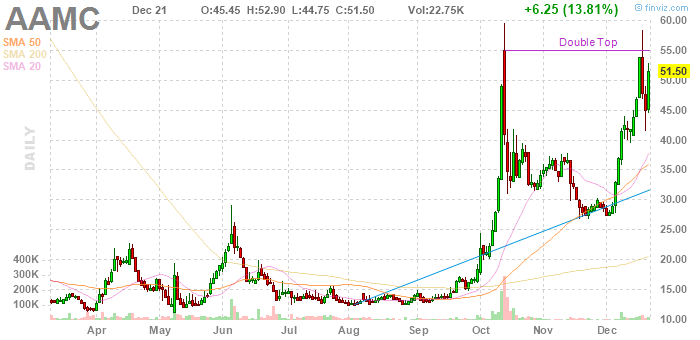
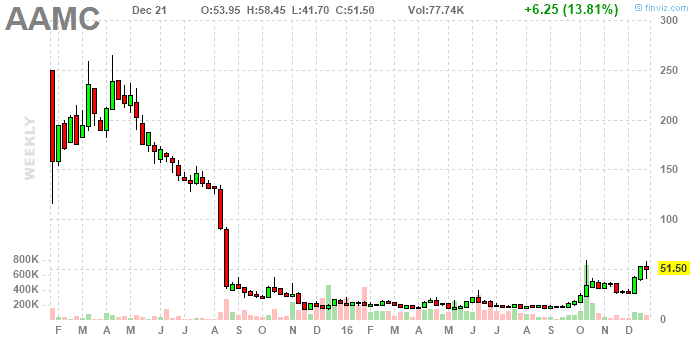
Looking at this from the perspective of buying in late August, with a stop below the July low, and maybe adding to the position in early September, while, also, the red bar in late September was a signal, with a stop below the tiny green bar in the middle of the month. Then, on the weekly chart, the tops in the fall of '015 should have been viewed as a selling area, with the ideal sell having been the top of the (second) extended green bar ... that bar having carried prices into the selling area. If that sell was missed, a sale at $35 was still profitable. I also flagged it in late October, at a good moment, but the rally didn't carry. Ideally then I would have had a stop under the spike low at $31. The red bar at the beginning of December was also a buy signal, and, with regard to that, I just flagged it as a sell. How will that work out?
There appears to be every reason (in the chart pattern) to think AAMC is headed for $200, and ultimately to $1000. Also, to go to $200 - and when it does I expect it to do so in a short period of time - it has to get past $60, where the October top promises to make it pause, or even turn back. Here it is at $60 again, and it's already pausing, but will it turn back? Really, it's already turning back, in my opinion. What I think it will do is a sideways pattern in the $20s, similar to the sideways pattern this summer. And then does the rally simply fly past $60? I'll leave that question open.
here are updaters
No comments:
Post a Comment