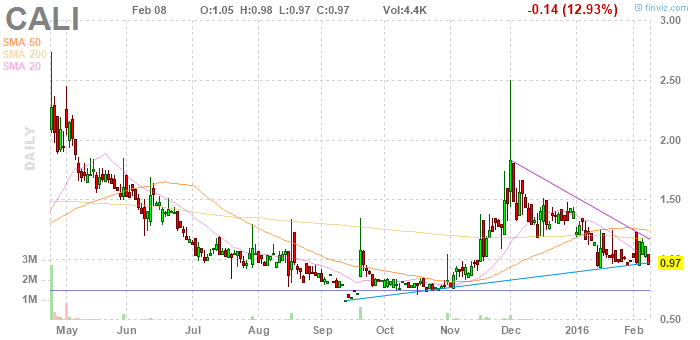
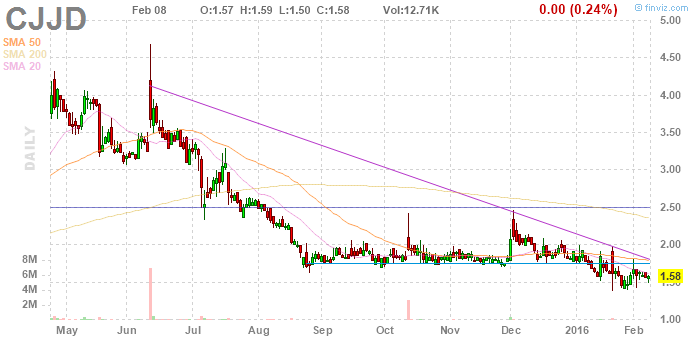
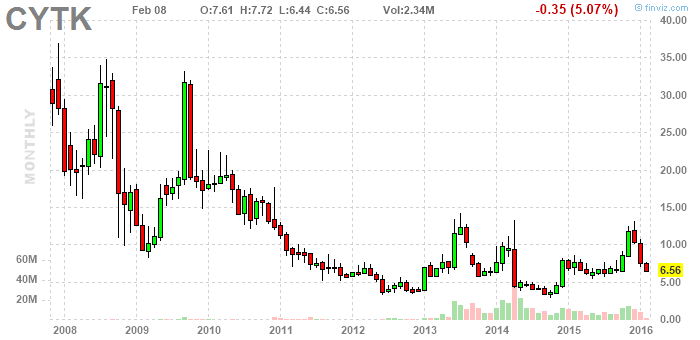
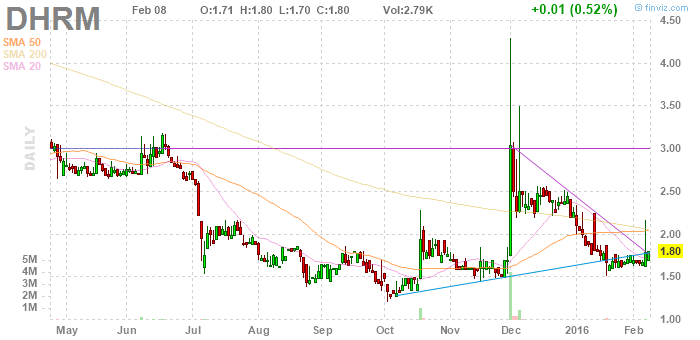
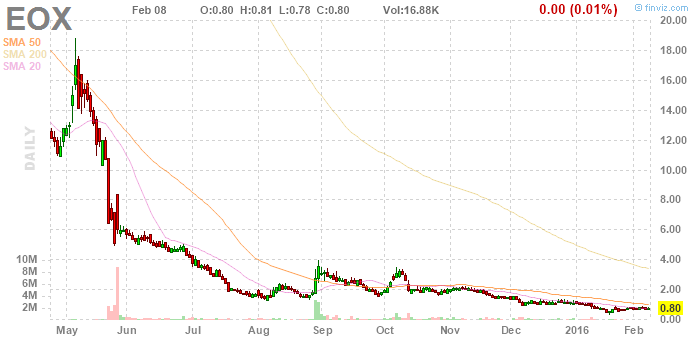
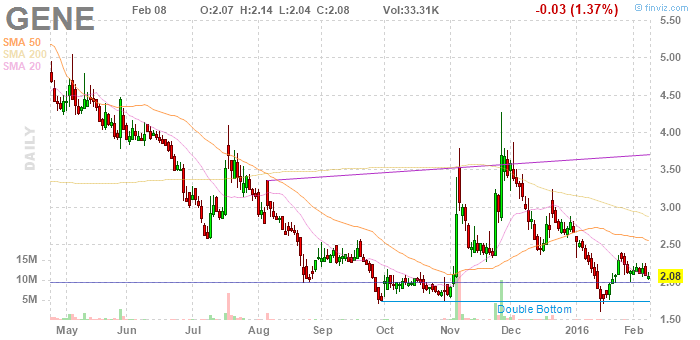
according to the theory i'm testing today a slight breakout above the most recent tops (under 2.5) would signal the next rally. target is 12. the spike to 22 appears to have been, in fact, real.
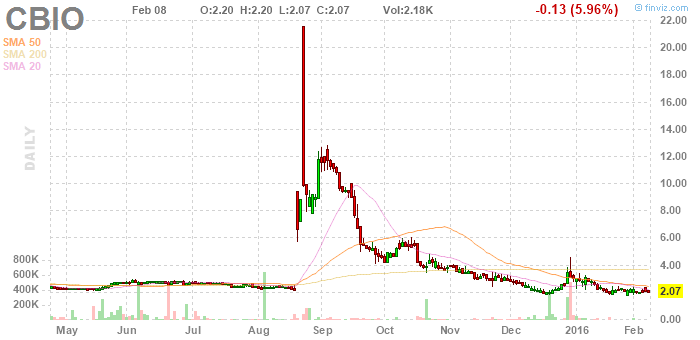
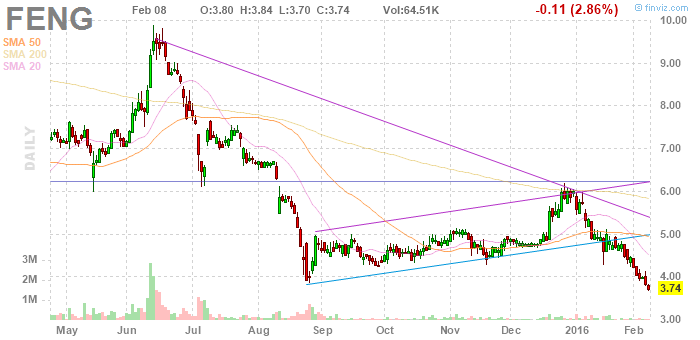
good for a double on the next move ... not so sure about this pattern ... wait for breakout, i guess
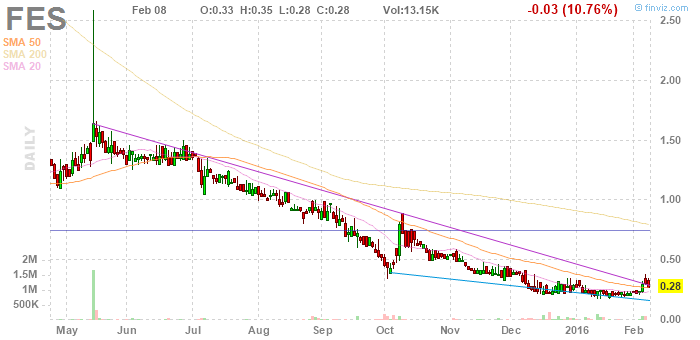
a dip is what we're looking for, and even then it won't be a really fast mover ... but, still good
what i'm doing is going through a list of high beta stocks, picking interesting one year charts. as you can see, i'm still in the cs.
these actually are needles. the trend is wrong, though. let's watch.
distinctly flagish, but it could take a while to actually move. we'll watch.
what about chutes? i thought "this is the kind of chart that forms in bigger stocks that are climbing. sure enough it's a failry large company with solid fundamentals.
cool! an example! ok, needleish into August, and up, too, then it dips. then needlish into October, then breaking out above tops. then ... and this is what we're particularly interested in ... meanders sideways and up for a period. then breaks out above multiple tops in a big green bar - two of them - and then makes a cool pick flag before jumping to a new level. oh la la!
why not watch it? could this be a long term pick? ach, phooey, that nice new level is an unadjusted split. but, yes, this company is legit. add it to the long term portfolio. (the pick turns out to be the beginning of a flag. and it is clearly breaking out on the long term chart.
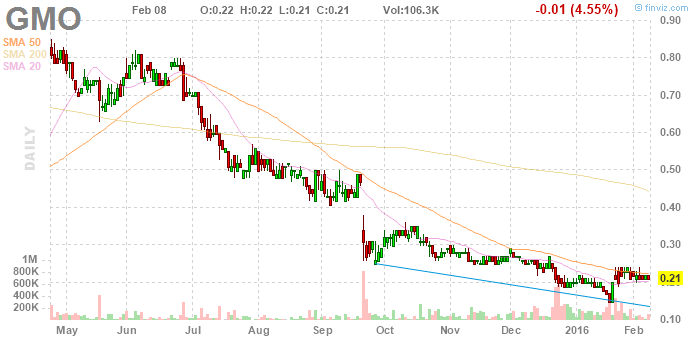
i don't want to hold this for the long term, even though it's rapidly growing and losses are declining. good chart, though.
a good signal could produce a 50% gain in one or a few days.
thing about a pattern like this is it could take months to really get going, but in the short term it's energetic. let's watch this on the intraday chart and see if we can get an instant 50% out of it. edit ... there's nothing to see on the intraday chart. it's barely trading. more of a daily bar pattern is what we're looking for, and a gap at the open would be a definitive signal (a gap up, that is).
good in the long term portfolio.
according to theory this should produce some kind of definitive signal and then a good day trade.
 these both could produce day trades any time
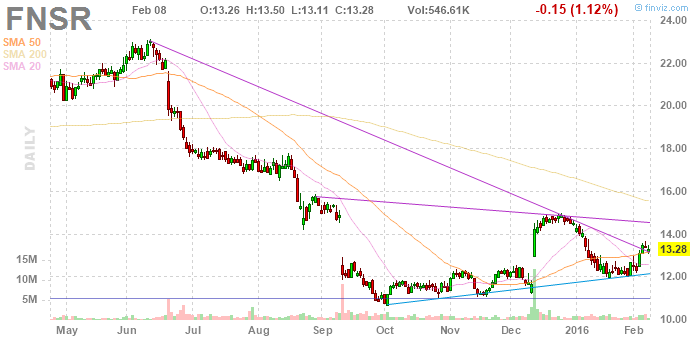
what can i say? this has a lot going for it. and it's a decent and exciting long term pick, too. but it also looks like it's going to double quick here and then take a pause. great short term setup, though.
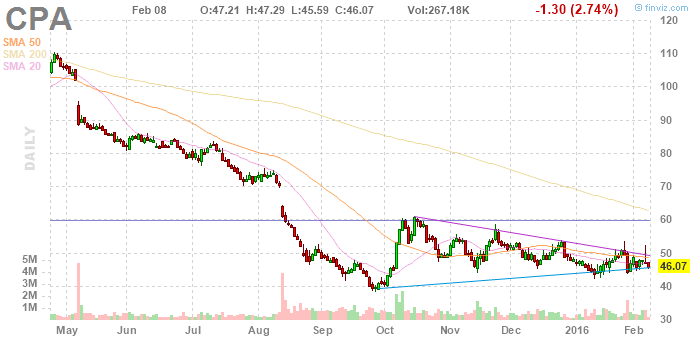
CPADT
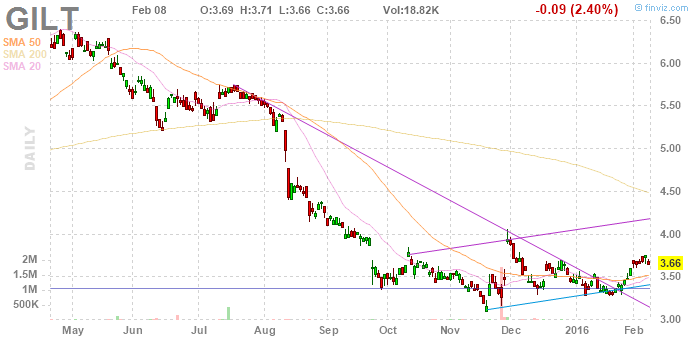
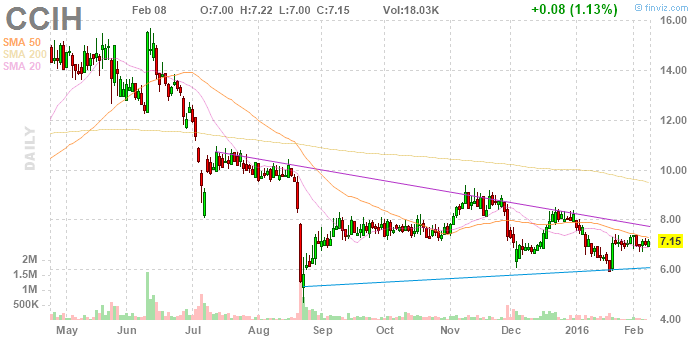
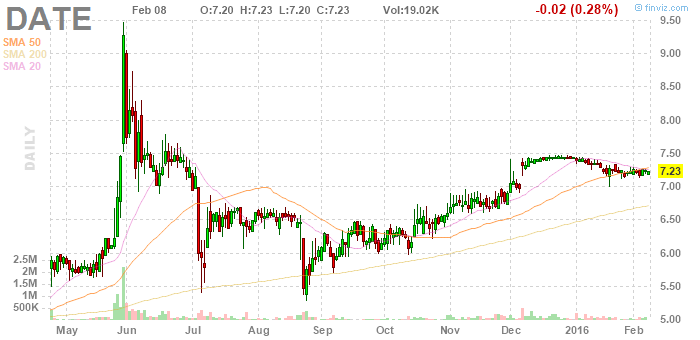
ok, this looks great. any kind of breakout now would be basically a trade. and it's a decent company - a satelite network, of all things. if it breaks through 11 it'll go quite a ways. but will it do that all in one go or will it pause, maybe for a while, at 11? i guess i'm viewing this more as a trade. they still struggle with earnings a bit.
ok, this is strictly a day trade. it's not a completely uninteresting company, but it's development stage. the short term chart is compelling, though. if it gaps up in the morning, buy it and sell it at the close if it's anywhere near a double, even +50%.
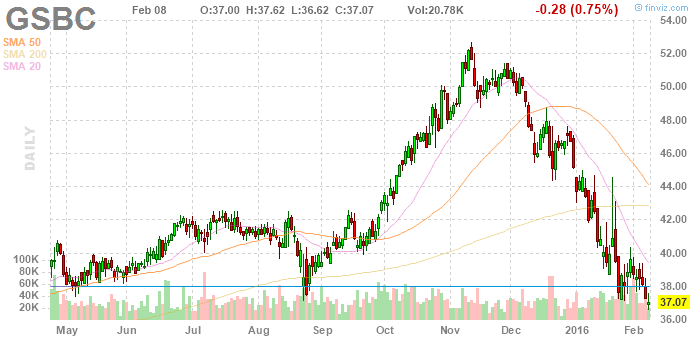
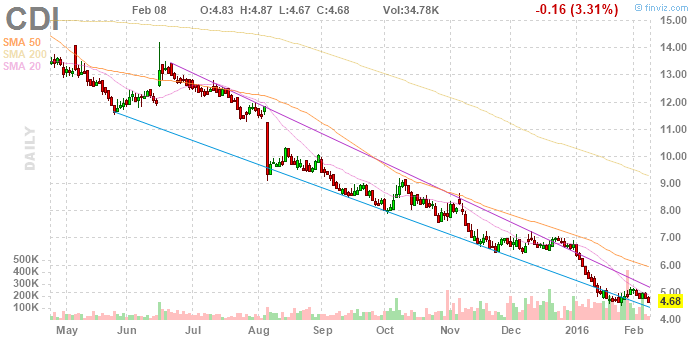
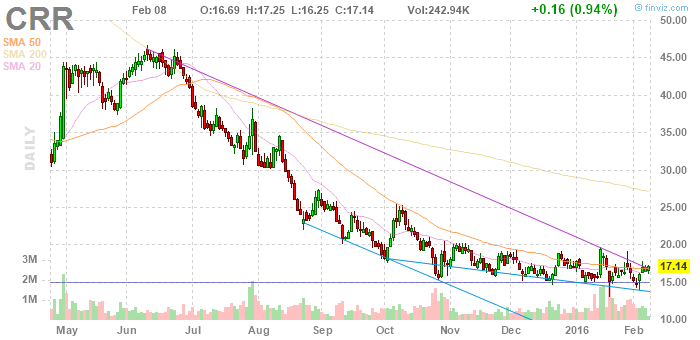
good value. pays a dividend since the beginning of time. earnings are slightly laggard. ideal long term chart for this kind of somewhat unambitious investment. hold it forever? ok. what will the actual bottom look like? i'm not seeing it yet.
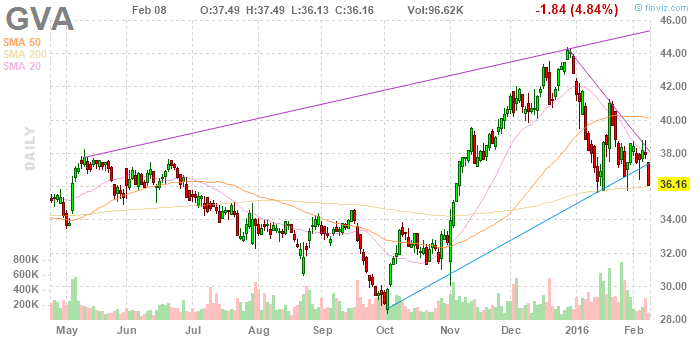
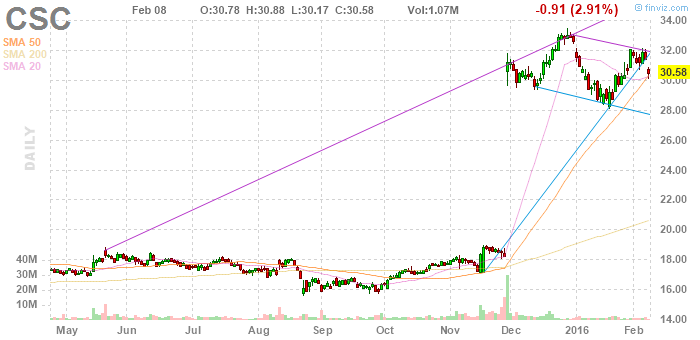
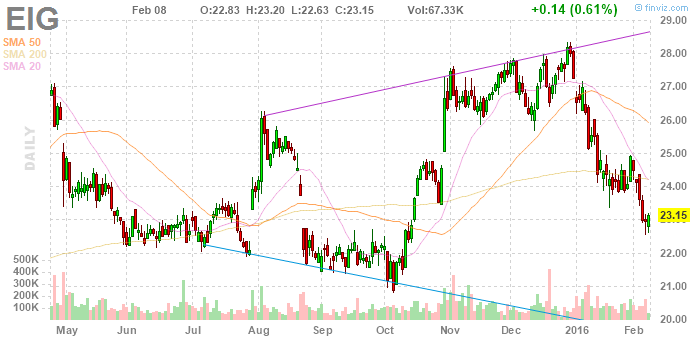
good pattern, even great. in the past i would have ignored it, and i almost did today, but, i'm changing. plus, it's an example, meaning we can see a dip and after that dip it went up nicely. so, we should study dips, that i already do, but here we can see precisely why. but the question is, where was the signal? the signal was a gapping open (preceded by a big green bar, that might be worth noting), and a purchase at the open seeing that gap would have been fine. what's more, there was a lightning strike to 30 a month later, and that's something we see from time to time, so we're seeing out of dips not instant advances - yes, but limited in size - but work, adding up to surges.
plus, this is in a buying area right now. it's a flag and it's up. 35 is the target price for buying. is this one of those keepers? fascinating. it most certainly is.
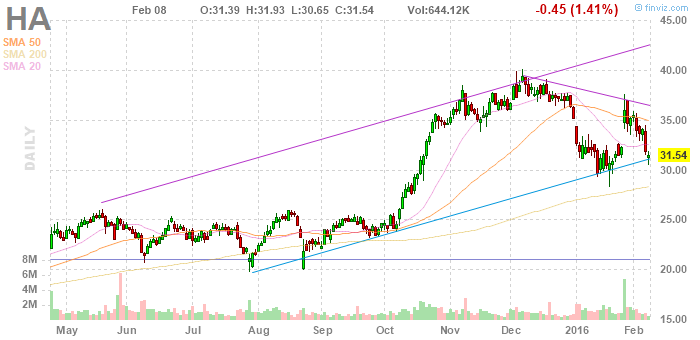
we like Hawaiian, right? it's one of those charts. at 25 it's decent value, and it's definitely growing. if we want to buy something that's really moving, there could be a worse pick. (giant. giant! i remember now ... this is a blue ocean company.
21 stocks and a third of the way through my list.
No comments:
Post a Comment