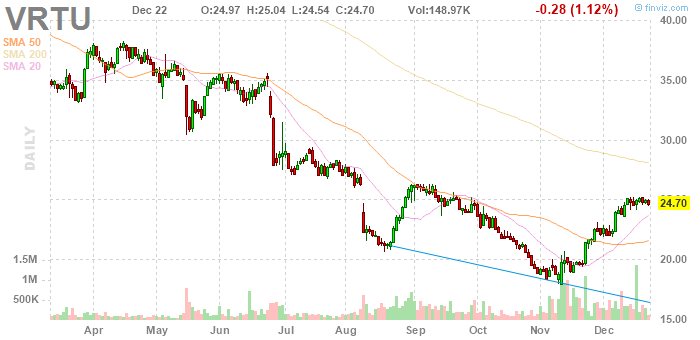
 I called it, but where was my stop? The bottom of the first green bar in November was fine (stopped out), and buying on the dip, the next day at the low of the red bar, sixth day in November, with the stop below the green bar of the fourth day (stopped out). Then, buying at the low of the lower wick of the winged bar of that seventh day, the morning of the eighth day, would have been very clever ... but would not have provided a stop. I guess early in that ninth day there would have been an intraday signal. Finally, on the fourteenth day of November it was clearly signalling a buy, but without an ideal stop, and then on the fifteenth day it was clearly signalling a buy, with a stop below the lower wick, and that was really good, buying at the real body high the next morning. As for the present, it's sort of a sell, but it could just pause, here, and in the monthly chart the target is ... well, at any rate, I'm saying wait for a real sell signal.
f y m
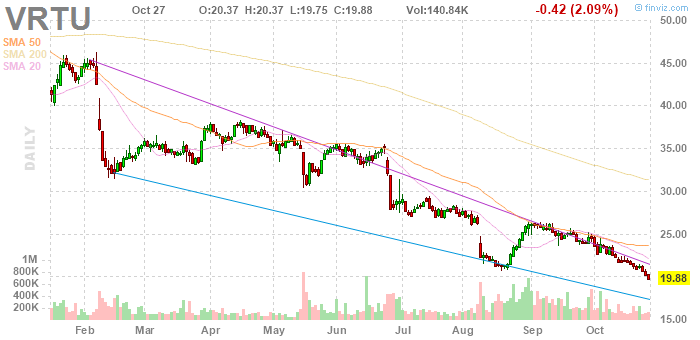 dipping right through. i was looking at it two days ago, thinking it needed to react off the August low ... and hadn't quite, or not convincingly. well, i get 1 point! now we wait for ... well ... something. it is cascading, and on the monthly chart
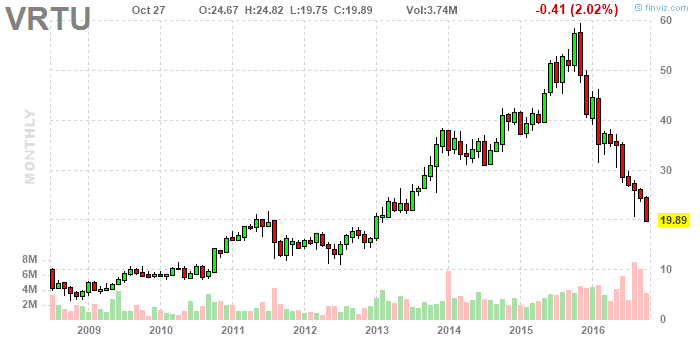 it is hitting support ... with 15 being a pretty prominent level. then what? 25, and it probably pauses in some fashion. does it make a big bottom pattern through 2017? or does it rally really strong back to 60 or spike to 37?
No comments:
Post a Comment