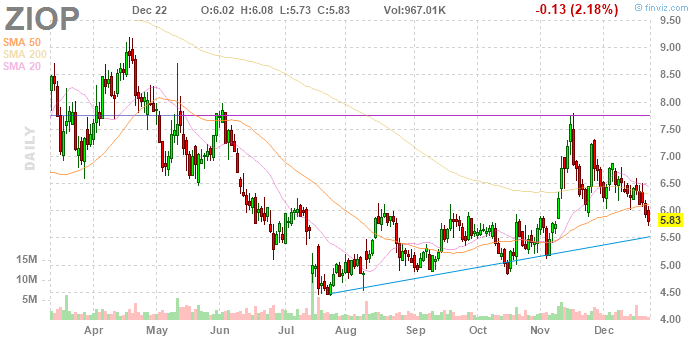
 Might as well update this. Don't know exactly what I was looking at in October, and, now, would have to say the signals then were, um, not so easy to read. I mean, there was the hammer in August, and its real body worked out as a stop, when prices dipped to the real body level in October. As for selling, once the mid November top was well in place, the top of the big green bar a few days later provided a good exit the next day. And then there's this: it's a buy right now, and the stop is $5.50 because of the small winged green bar the sixth day of November. Maybe now it'll do that spike to $10 (or above).
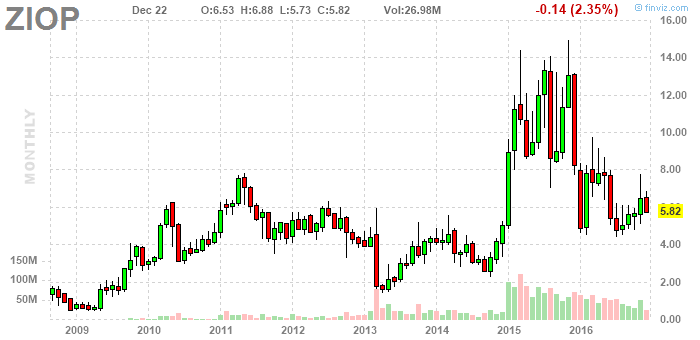 Really, looking at that monthly chart it should go who knows where.
f y m
 looks to spike up above 10, to 12, perhaps. lots of cash, but, debt. growing a bit.
No comments:
Post a Comment