This chart makes me want to look at stocks that are ... hmm ... week down, crossing the fifty day moving average... hmm ... 50 day ma above 200 day ma ... and then I can scan the charts for attempts to break out above an earlier top ... and little cascades turning red to green. Um ... OK.
But this chart makes me just want to look for anything crossing the 50 day ma in an upward direction, off of a cute micropattern, after numerous previous attempts, and with a solid green bar. Um ... OK.
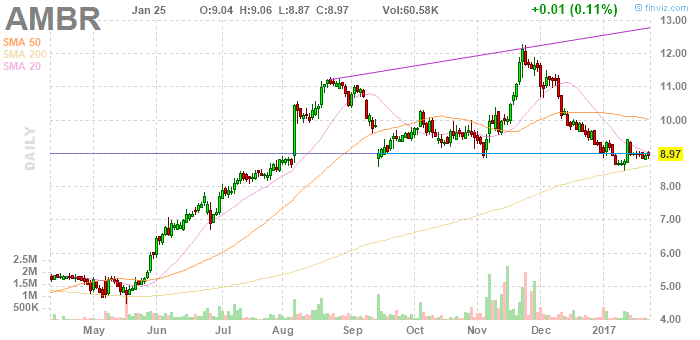
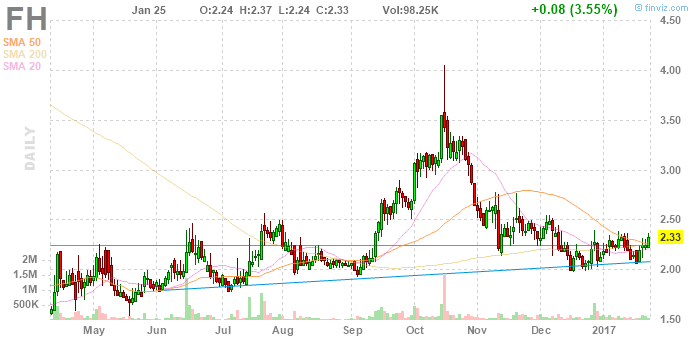
Hmm ... it's been tracking just under the 50 day ma, poking through several times, then breaks it with a hammer with the real body above it (above the ma, breaking through the ma). It's still price crosses 50 day ma in an upward direction.

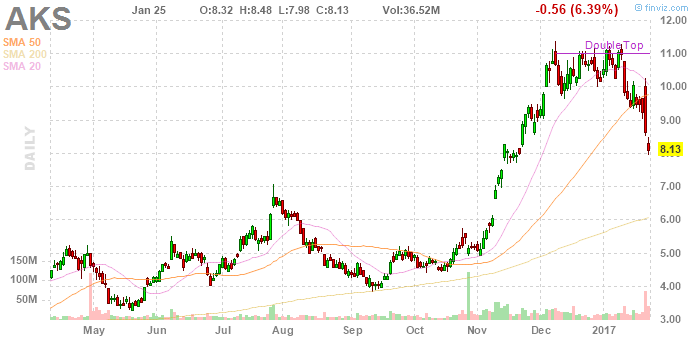
Price tracks just under 50 day ma, then breaks through with a little gapping green inverse hammer. It's not a fast result, but it's sustained. What about sell signals. Breaking the May top doesn't produce a sustained move ... it even pauses ... and then the October top high completes a rising galaxy. Then a run of successive widely spaced green bars end in a peak.
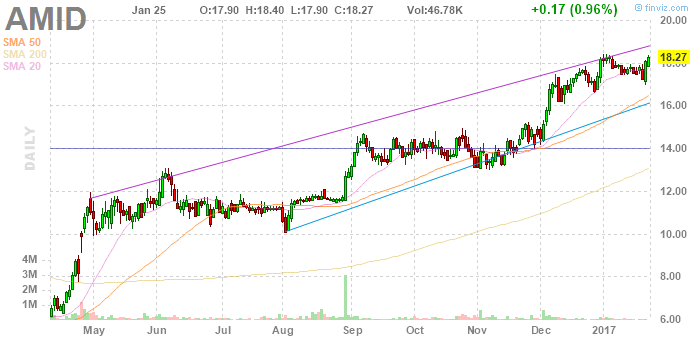
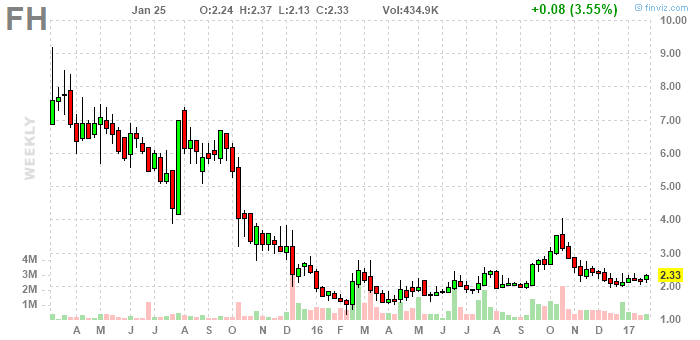
Crossing the 50 day ma violently (in May) does set up opportunities (June, November) ... though the paced is leisurely.
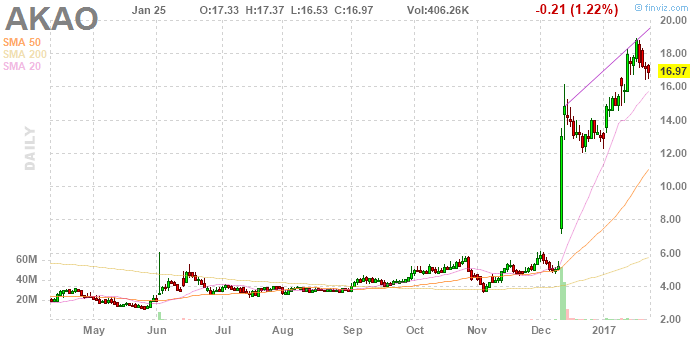
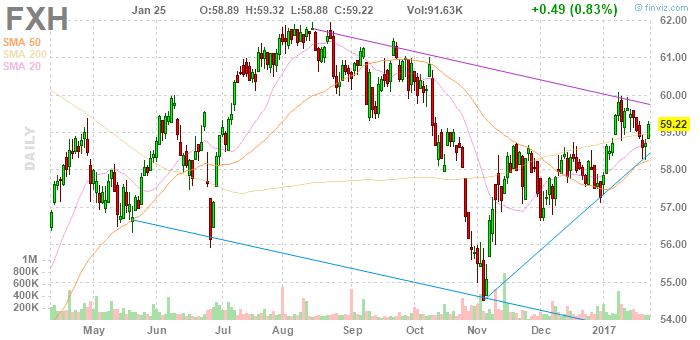
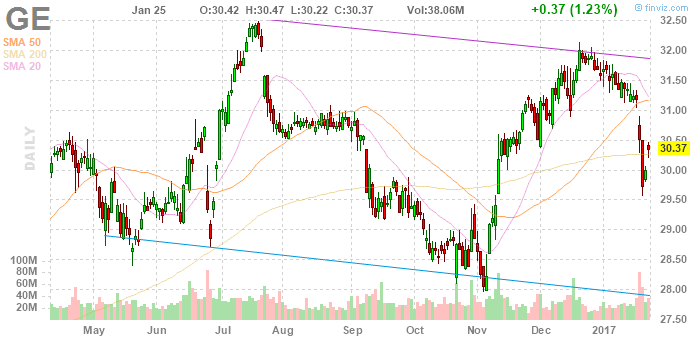
Finally crossing the 50 day ma completely in late May, after dipping below it for a month (between the lines), it then moves steadily upward. (The big green bar early in August was a good sell signal.) (What about right now? It's clearly reacting off the 200 day ma but it hasn't crossed the 20 day ma yet.)
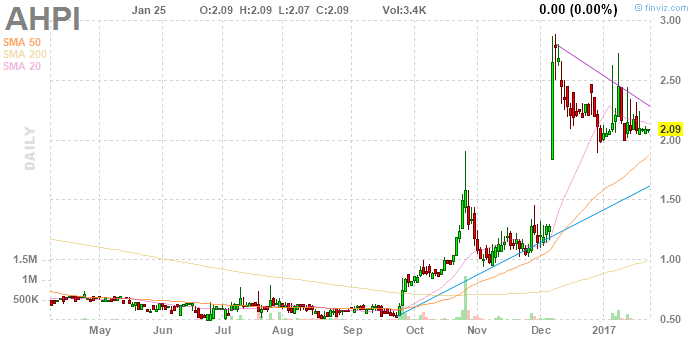
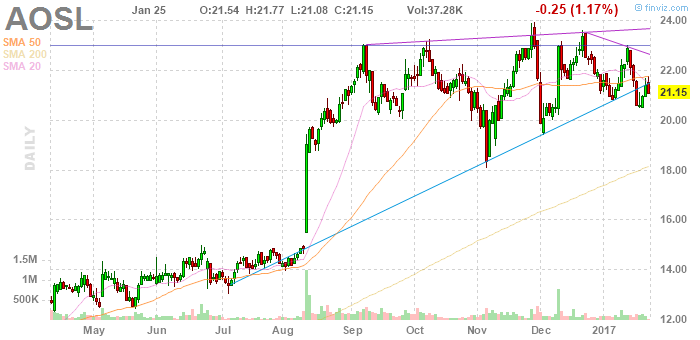
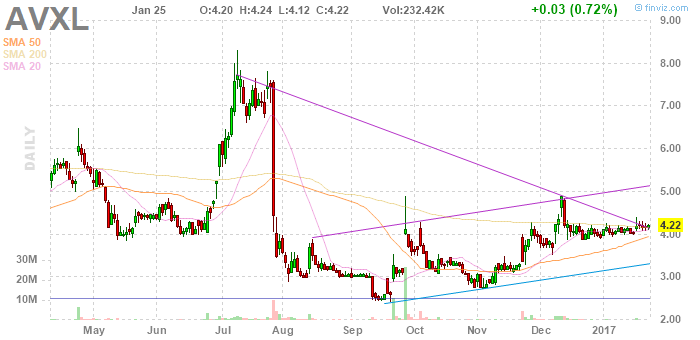
Crossing the 50 day ma in an upward direction failed five times between September, October, and November, then would have rewarded perseverance the sixth time ... and it was 50 day ma above 200 day ma and both moving upward.
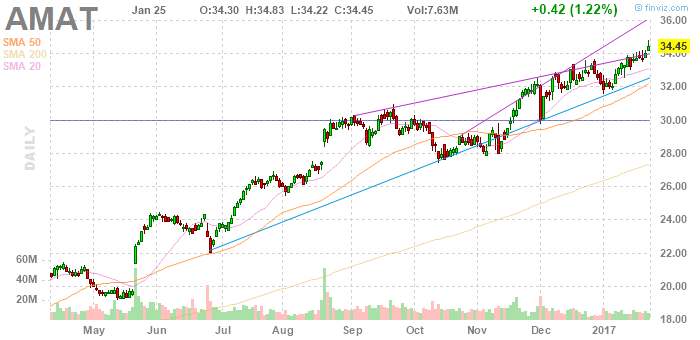
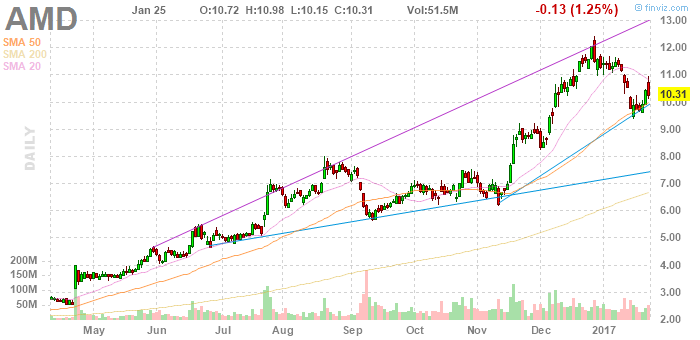
Crossing the 200 day ma was followed by what is now a sustained rally. Tracking first below and then above the 50 day ma eventually produced a +15% week, and dipping below it and then jumping back above it (and then hugging it with a red cluster) was followed by a +20% month.
Touching the rising 50 day ma above the rising 200 day ma twice from above (after a brief dip below it) produced a +30% month.
Now I'm wondering what to do with all of this.
Breaking up through the 200 day ma in September and making, there, two green inverse hammers, with their upper wicks poking above all the mas ... hmm ... the present moment resembles that quite a lot ... what would have predicted the October top?
 Reflecting on this makes me think it's only good for +50% ... no, less.
Oscillations around the 200 day ma. After further study I'm recording this as a buy in tests.
Could produce a +10% move ... with 1 or 2 % of risk.
No comments:
Post a Comment