f y m
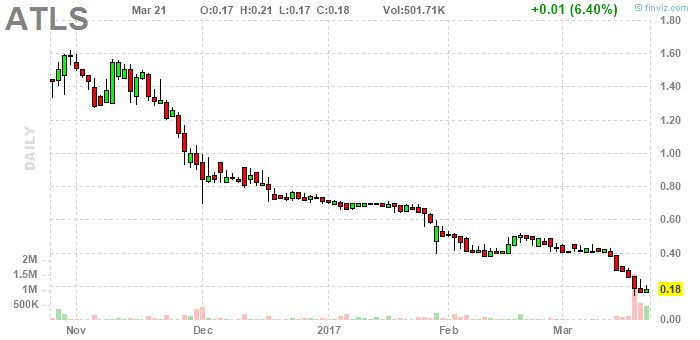
wellllllll ... it's a pretty cool pattern on the daily chart ... a 50% move tomorrow?
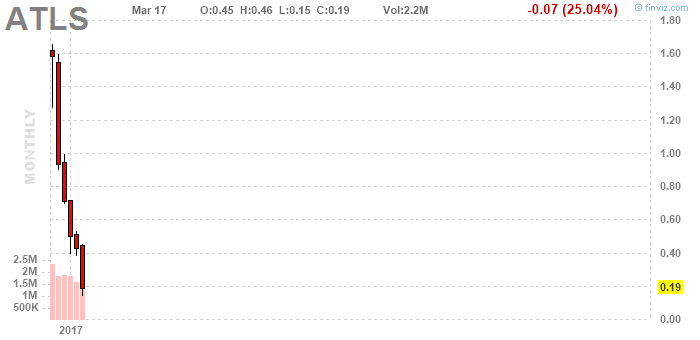
crazy, completely crazy, but what is it doing?! right in this chart are endless examples of this kind of pattern failing (to be a bottom) ... a red point ... the second bar shorter than the first ... point ... and red bars everywhere. ordering 10,000 at a penny, and if it fills, selling at 10 cents ... but i would have to watch the market.
 lol
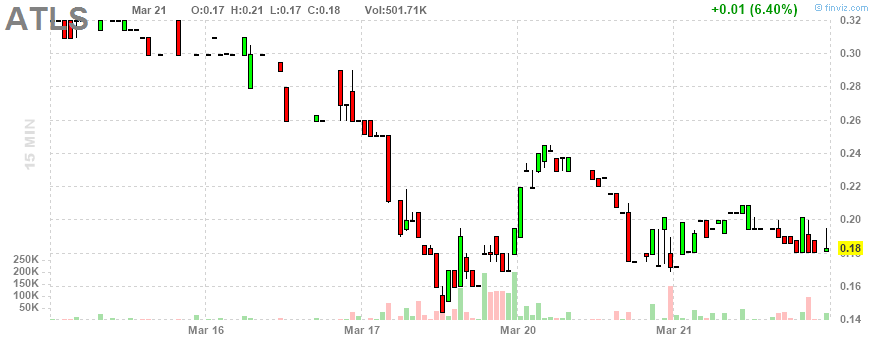
lol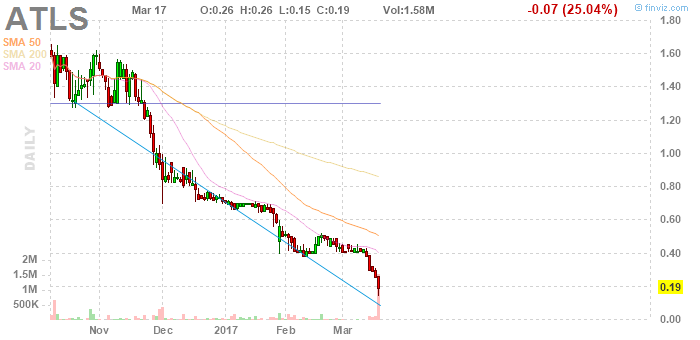 kind of bounced ...
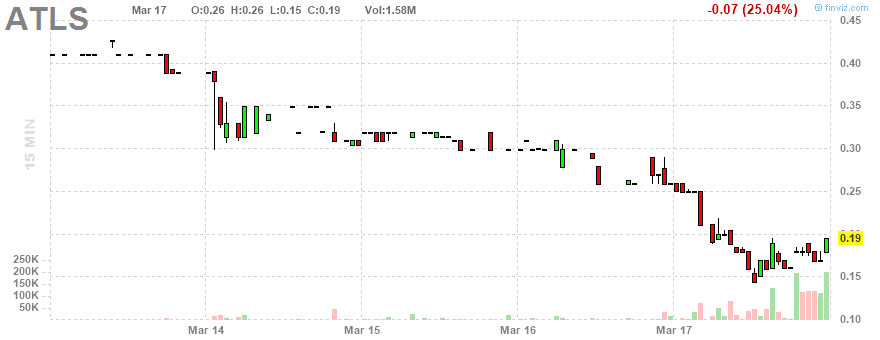
i know what bottoms look like and this isn't one quiiiiite yet ... these can be bouncy, tho
No comments:
Post a Comment