Showing posts with label open trades. Show all posts

Saturday, October 1, 2016

TLOG

   f   y

TLOG
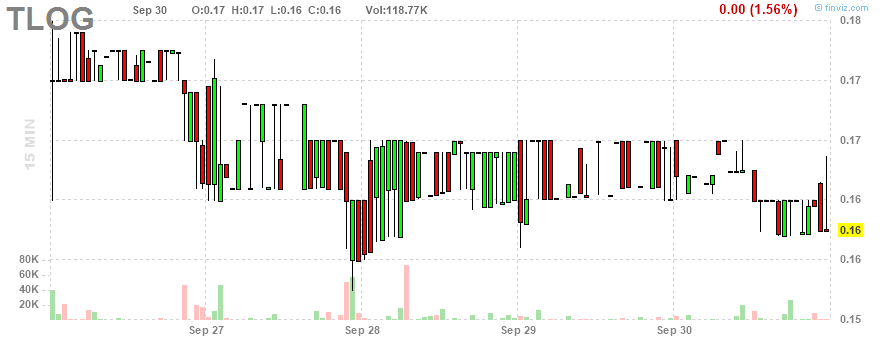
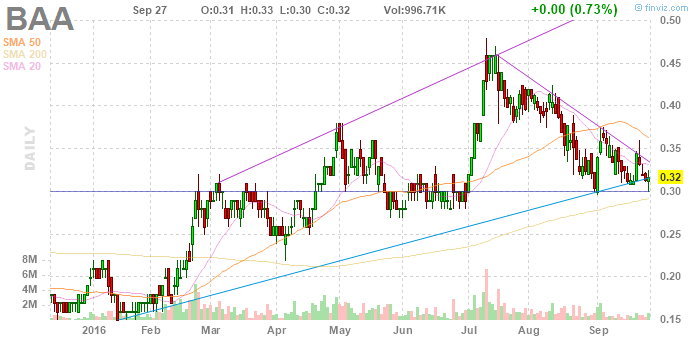
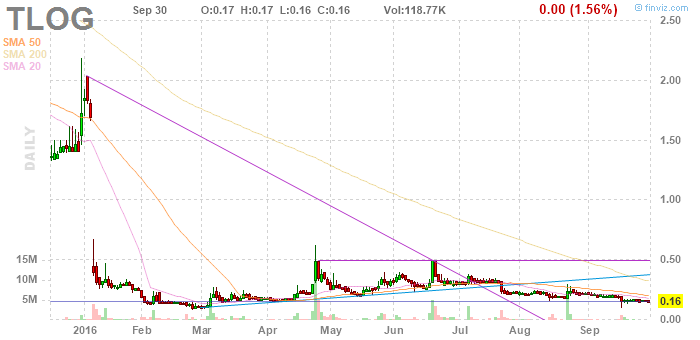
sell at 50 cents. that's clearly marked. nice pattern right now, in fact, very nice pattern offering a buy at 16 cents.multiple inverted hammers in a flag on the five day chart. hey, i've got it! it's a buy at 16 cents even Monday.

OK, the Finviz five day chart is just wrong, and the actual buy price based on the five day chart is 15.6. no, i mean .156. and on the one daily chart, 1 year chart, there's a major target at

maybe this makes more sense: it'll probably go to .3, then back to .2, then to .5.

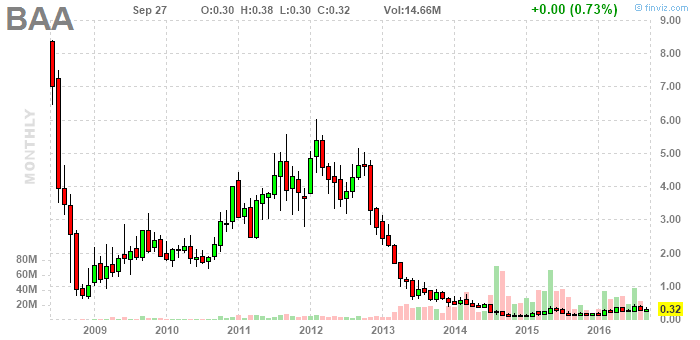
well, it is primed to go to 2, it just seems unlikely it'll go directly there. i mean, i'm looking at a weekly chart now, which is pretty interesting. on the weekly it could go pretty directly to 2, but in actual fact it'll probably do some work at these lower prices first, and that could show up as some fast action in the coming days, with opportunities to buy and sell, looks like i'm saying, twice. buy twice, sell three times.

buy it at .16, sell it at .30, buy it at .20, sell it at .50, then buy it at.30 and sell it at 2, and sell the original $100 worth at 2, too. OK, i like it now.

one lesson is that perfectly good patterns on intraday charts often don't mean a thing. occasionally they do mean something, but very often they don't.

an alternative approach would be to wait for moves from .16 to .3 and then from .2 to .5 and then buy it at .3 for 2. whatever.

waiting another day to alert this ... and maybe a few more weeks.
from notes, October 1, 2016.

Friday, September 30, 2016

ACPW


   f

RGSE

for 9


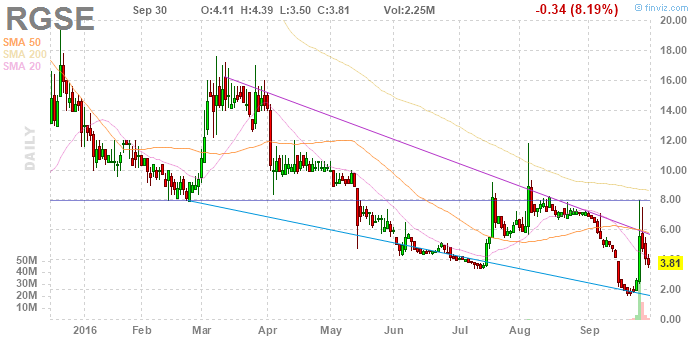
ultimately decided to order 30 shares at 3.82, and that i'm definitely looking for a price of 15.

Saturday, October 1, 2016

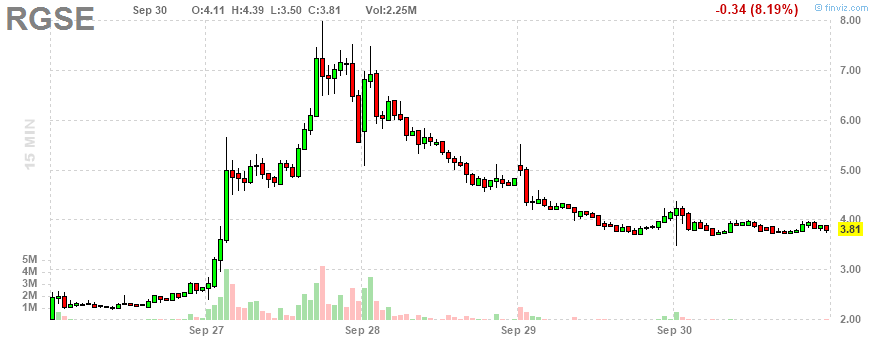
RGSE at 3.81 Monday morning, and as soon as it fills you place a stop order at 3.75, to sell. it could go to 14 next week. if it does that it would only be for moments, and if we can't sell it on the day it rallies to anywhere above 9 then the next day we try to sell it at 9. also, if u look at it during the day and it's anywhere above 10, and you feel like selling it at the market, just do it. 

the rest of this RGSE post is just a story, except for the link to a chart at the end.

it was really cool the other day because i was watching RGSE up above 7, and it was making a pattern, three minute bars, and i was thinking "this is really great". come to think of it i could have (this was paper trading) placed a sell order at the market right then and i would have been assured of a sale, and probably very close to the top, which turned out to be a significant top. the pattern it made was a big green bar. it had been rallying more moderately and then it jumped up. i'm pretty sure this all happened in one day. ok, now i remember it and i know it did. it climbed in waves in the morning, and then early in the afternoon - NY time, i'm thinking - it made two big green three minute bars, and then right after that it topped out and now it's down 50% and i want to buy it again. 

watching this was a great lesson. it did exactly what i thought it would do, to the extent i had an exact idea of what i thought it would do, only a day later than i said. i thought it could stop at 5.50, based on the chart from earlier in September, but i'm sure i also thought it might go to 7, which was marked by a classic pattern, the inverse hammer top in the 1st half of September plunge. then i was actively watching it as it went above 7 on the day of the big green candle. in the intraday chart it was making a very complete sell signal there ... but i was reluctant to sell it, thinking maybe the move would carry and break out and head for, you know, wherever. now it's down under 4, so, if we had sold (if we had owned it) at 7, we wouldn't be unhappy about it. Next: it's making a very nice buying pattern on the intraday charts, and now i understand it better. Basically, the target is 9. i mean, it sort of should be headed for 12, here. if it gets to twelve, that's almost certainly a top, and then it could start building a flag. my new basic rule is, if it's not a flag, it's not a buy. there are exceptions, but this isn't one of them. well, it is, but for a big, long term type move, it usually has to come out of a flag, or maybe always. OK, looking at this very carefully, the likely next top is at 11.80, and then it can start to build its flag for a move to 25. i'm optimistic about the company for the not too long term, but really making money in it now will require playing the fluctuations. actually, 11.80 should be exceeded on the next move, which i imminent, but only for a moment. after that the flag should return prices to essentially the current level. This two year chart was helpful.
copied to ... um ... favorites

Tuesday, September 27, 2016

GALE


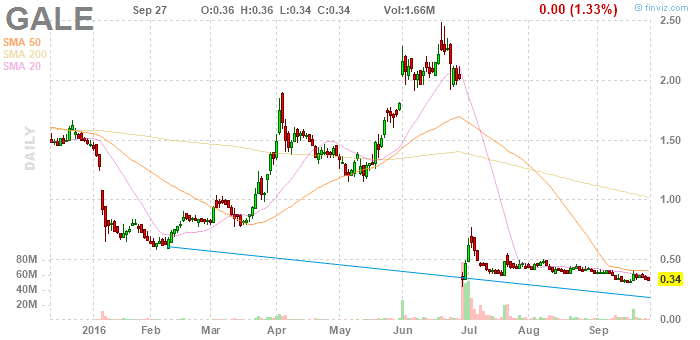
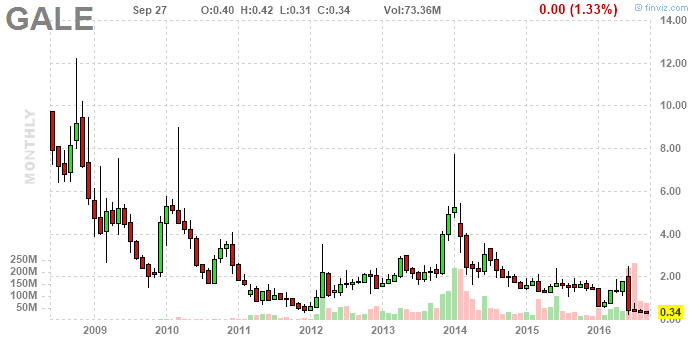
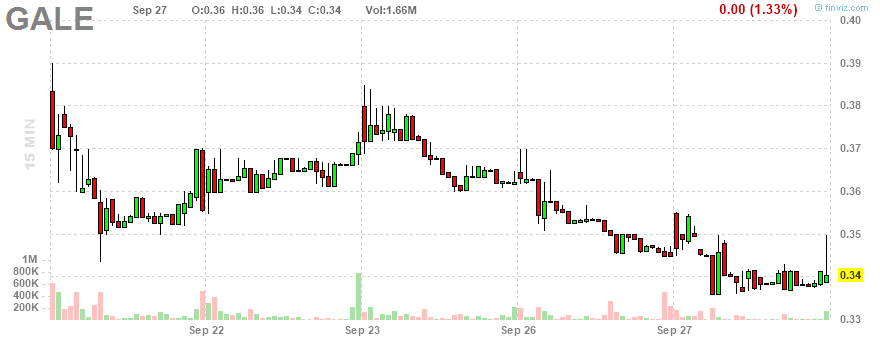
f zip, fundamentally, but something's up. headed for $3.

the news is they presented at a conference in Switzerland today earlier

BAA


f

original post

Tuesday, September 13, 2016