TLOG
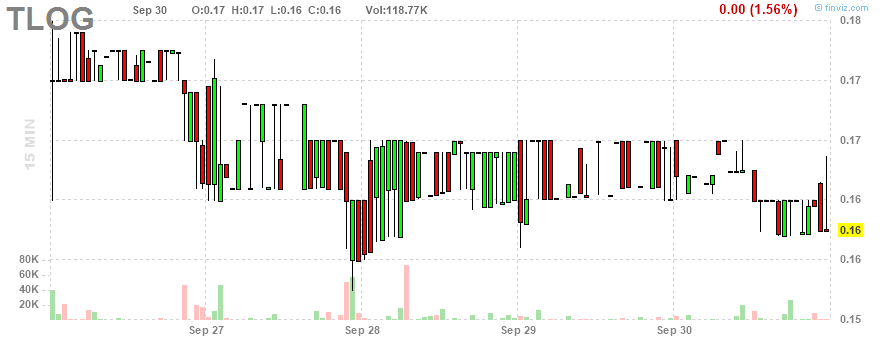
sell at 50 cents. that's clearly marked. nice pattern right now, in fact, very nice pattern offering a buy at 16 cents.
 multiple inverted hammers in a flag on the five day chart. hey, i've got it! it's a buy at 16 cents even Monday.
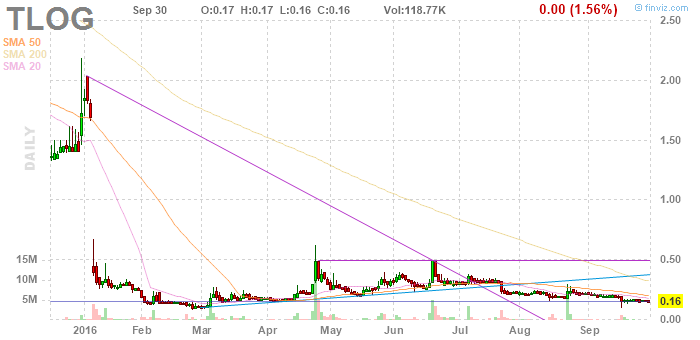
OK, the Finviz five day chart is just wrong, and the actual buy price based on the five day chart is 15.6. no, i mean .156. and on the one daily chart, 1 year chart, there's a major target at
maybe this makes more sense: it'll probably go to .3, then back to .2, then to .5.
well, it is primed to go to 2, it just seems unlikely it'll go directly there. i mean, i'm looking at a weekly chart now, which is pretty interesting. on the weekly it could go pretty directly to 2, but in actual fact it'll probably do some work at these lower prices first, and that could show up as some fast action in the coming days, with opportunities to buy and sell, looks like i'm saying, twice. buy twice, sell three times.
buy it at .16, sell it at .30, buy it at .20, sell it at .50, then buy it at.30 and sell it at 2, and sell the original $100 worth at 2, too. OK, i like it now.
one lesson is that perfectly good patterns on intraday charts often don't mean a thing. occasionally they do mean something, but very often they don't.
an alternative approach would be to wait for moves from .16 to .3 and then from .2 to .5 and then buy it at .3 for 2. whatever.
waiting another day to alert this ... and maybe a few more weeks.

from notes, October 1, 2016.
No comments:
Post a Comment