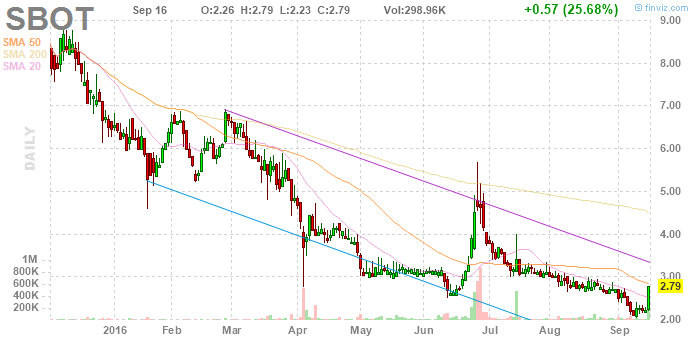
I call the pattern made in early April a heel, and it seems to me after prices return to the area of a heel low they often jump up sharply.
Definitions:
return: in order for a heel to form, prices must jump upward (after first jumping downward). returning means, after jumping upward, prices slide downward again.
area of (heel low): looking at multiple examples of heels, we will see that prices often jump up after prices return precisely to the heel low, but also that prices sometimes jump up after a return most of the way to the heel low, and also that prices often jump up after returning to the heel low and then going somewhat or even substantially lower. the range of prices between somewhat above the heel low and somewhat below the heel low is therefore the area of the heel low.
sliding downward: by definition a heel forms when prices jump upward - after jumping downward. narrowly defined the heel itself is a single bar that describes both jumping downward and jumping upward. the heel is usually, maybe always, as here, followed by some more upward motion. we can then expect prices to gradually decline (where the heel itself is prices instantly increasing). ultimately, we can expect a toe to form, corresponding to the heel. (of course it's strange that this visual metaphor has predictive value, or may have predictive value, but tell me you don't see the heel and toe here.)
It would perhaps be possible to construct a profitable system based on buying at heel lows when prices return, in a toe pattern, to the heel low, but, as suggested by the idea of returns in the area of heel lows, variability is to be expected, and any attempt to catalog heel returns will show that prices often proceed, after returning to heel lows and making toes, to prices below and even well below the heel low, before making any kind of sharp advance. Without meaning to imply that I have figured out the heel and toe pattern, I would say I am interested in signals that might appear in charts during toe development, which might indicate that a sharp advance is finally imminent. In this example, a toe was completely in evidence by early June, and then what followed was a dip: prices went emphatically down for two days. After that, as you can see, prices promptly rallied. This pattern can be found in many examples. It should be noted, however, that dips, too, are subject to variability. Here, the second red bar in June had a lower wick, or sharp bottom, and it was followed by some green bars, the first of which was an inverted hammer, and the whole pattern at that point strongly suggested that the dip was done and a rally could be expected, but I have seen examples of red bar cascades of this sort with bottoms and green bars in place, where prices then proceeded lower, forming additional cascades - and cascades represent dramatic declines, so a trader caught in a cascade will suffer.
One solution would be a stop. Inverted hammers represent an opportunity to buy in the area of the hammer head, and this at a low price relative to the hammer handle, and here the hammer head was quite near the wick low of the second red bar in the cascade, so buying at a price represented by the hammer head, with a stop below the wick low, would have limited risk to a low level, at least in theory, while the upside at least turned out to be substantial, in comparison to the risk represented by this plan.
Let us now address the delicate question of selling. Without providing an extended discussion, it can at least be seen here that prices did return, after having declined to form a toe and a dip, to the level of the sharp point of the high after the heel, and there's reason to think this could have been expected. Of course, we have an example of the pattern here, but we can find others. Given that, let me add that, here again, we ought probably to expect variability. It's certainly possible that in some cases of sharp advances out of heel and toe patterns, prices will proceed to levels far above the post-heel top, and in other cases prices will reverse before reaching the post-heel top. Whether anything can be done to assess the validity of a post heel top as a selling level, in any particular case, I think I cannot say without further evidence. We do have, in this example, the occurrence of a red bar (with a sharp upper tip, moreover) on top of a sequence of green bars, and certainly prices declined after that. Something to consider ... and really not more than that. Based on my experience, the reader will need to study patterns extensively to achieve reliable results.
Definitions:
wicks: the term comes from candlestick charting, which the reader can research. Here is the Wikipedia article.
The Wikipedia article on stops. Stops are difficult, tricky, and painful. The reader should study them extensively. The information provided here is only an introduction. The standard stop loss order does not in any way ensure an advantageous price, and can possibly, even very possibly, result in very un-advantageous results.
sharp: as applied to tops and bottom, the term describes a visual effect in a chart, which in turn represents a rapid increase in price followed immediately by a rapid decline in price, in the case of a sharp top, or a rapid decline in price followed immediately by a rapid increase in price, in the case of a sharp bottom. as applied to simply a change in price, sharp describes a substantial change in price over a short period of time.
inverted hammer: the Wikipedia article is quite limited, but it has some links. see also the standard hammer article.
It may be noted that, after sharply increasing in June, in this example, the price, after an initial sharp decline, gradually declined into the end of August, and then dipped. This dip, too, was followed by a bottom and short bars near the bottom (a variation on the inverted hammer discussed above), and, in very similar fashion, offered an opportunity to buy with a stop, which opportunity has now been followed by at least the beginning of a rally. For future reference, a dynamic chart (one which updates with the latest data when the page is loaded) is displayed below:
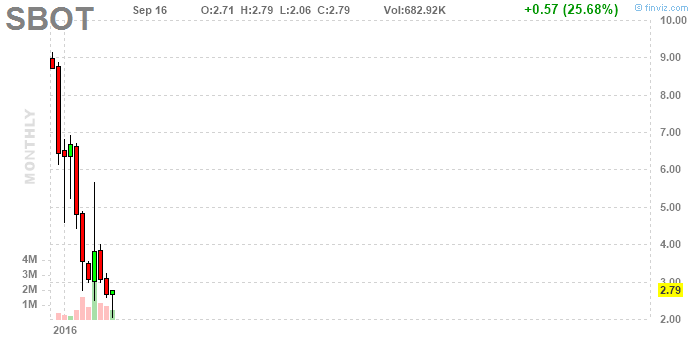
The next chart illustrates another pattern I always am interested in: a new issue which has sharply declined. I'm assuming this is a new issue as of late 2015. (There is no Wikipedia article for new issue, but the topic is addressed in the article titled Primary Market, and I am in particular thinking this was an initial public offering. The term is linked there.) At any rate, I have seen quite a few examples of charts such as this except followed by a return the high prices in the chart. And, having said that, it should be obvious to the reader that this does not guarantee a return to those high prices in this or any similar example. I will leave a more more extended discussion of this topic for another time and place ... only noting one possible item of evidence to support the hypothesis in this case, and - I've decided - one additional thought. It is reported as of 6 30 2016 that this company has $7,730,000 of current assets and total liabilities of $840,000, which could be interpreted as being a reliable cushion for continuing operations. (Based on these numbers the price to book ratio is a bit over 2, which is a bit above the strict definition for "value", as given in The Intelligent Investor, chapter titled "Stock Selection for the Defensive Investor".) The additional thought is that the June top should perhaps now be regarded as a place to hope to sell or to see a significant sell signal develop.

the above is the "fixed" chart, which will always show the pattern at the time of this writing. the below is the "dynamic" chart which updates with the latest data.
In conclusion, here are two resources: Finviz, who I would like to acknowledge for the charts used here, and MarketWatch, which seems to be always very complete and sometimes can provide information not available at Finviz. Actually, let me add that YahooFinance charts, though I find them to be rather cranky, have certain advantages.
No comments:
Post a Comment