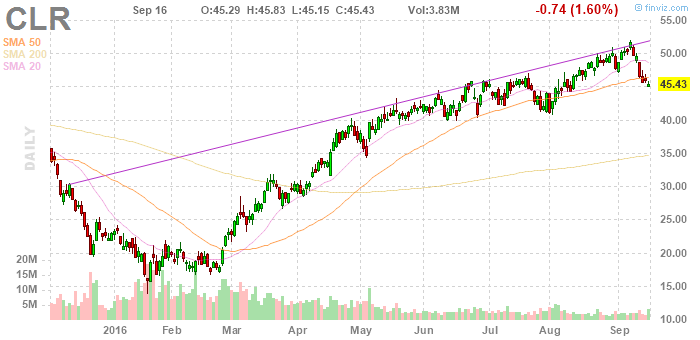
what was in this chart in February to suggest a coming rally?
i see a little green cluster
it is above a pointy bottom
that bottom did have shoulders
sigh
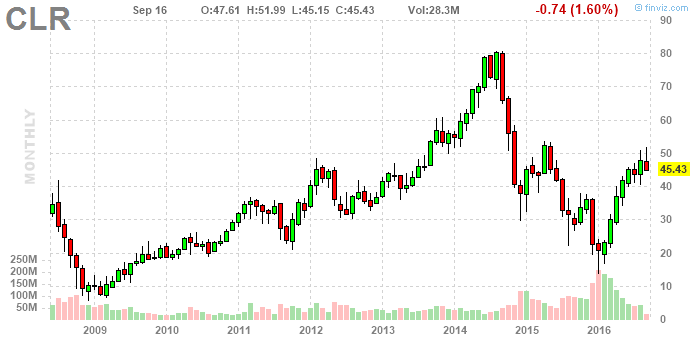
in the monthly chart?
well, it was an alp
alps slope up gradually on one side, and down steeply on the other (famously)
also, the steep down slope began steeply
the made some big waves, with sharp bottoms
forming a kind of foot
and this all concluded in a big red bar
No comments:
Post a Comment