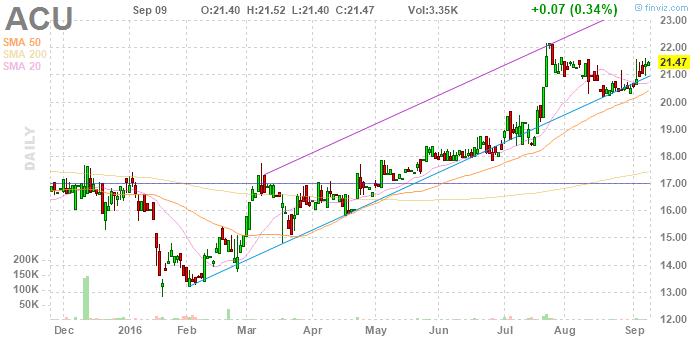
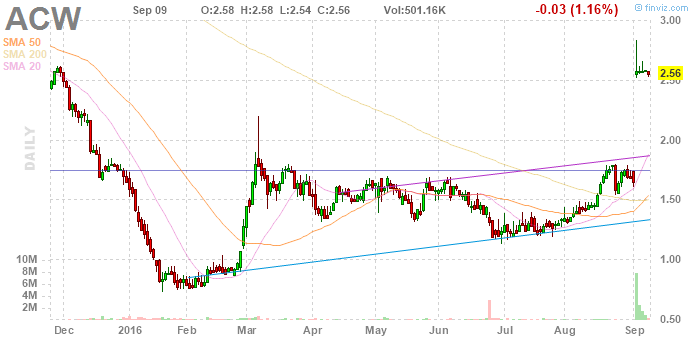
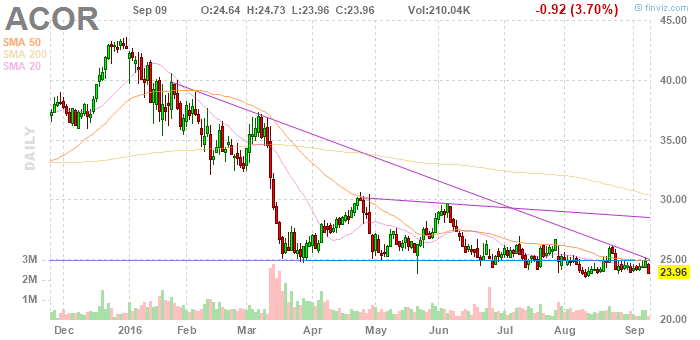
actually, one thing i wanted to look for today was examples of bottoms above pattern boundaries. kind of forgot about it until i saw the pattern in ACW, and was going to quit, but decided to see if i could find some more examples of the pattern, and found this. look at the daily chart, which is the second to last in the group. it's a complex and complete looking bottom above the 2014 high. checking the fundamentals, very consistent earnings, on growing revenues (over a five year period), good p/e ratio, and book value is a little low, given the price ... p/b of 2, where we'd like to see it at 1, but really solid current ratio ... basically, very strong financials to back up the idea that this is a good long term play. oh, it's a company we all know, good old Acme Office Products (Acme United Inc., formerly Acme Shears). pretty cool. if i was looking for investments - safe, sound ones - i'd pick this. hope you don't go crazy and put all your money in on my say so. i'm just saying that, from what i can glean from Ben Graham, Warren Buffett, this looks like their kind of thing. ask you adviser about it!
an example. double fairly fast twice in a year. notice how in May it went to the top of the earlier big red cascade. oh, and in August it surged out of a rising wedge, then pulled back and made a bottom above the wedge. at that point the price was $1.75, so it's not a double yet, but on the monthly chart the target is 6. f
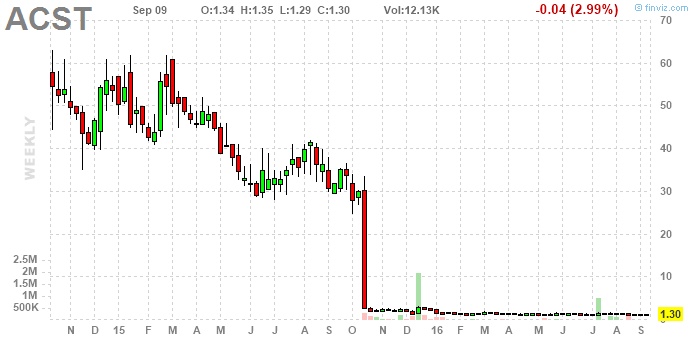
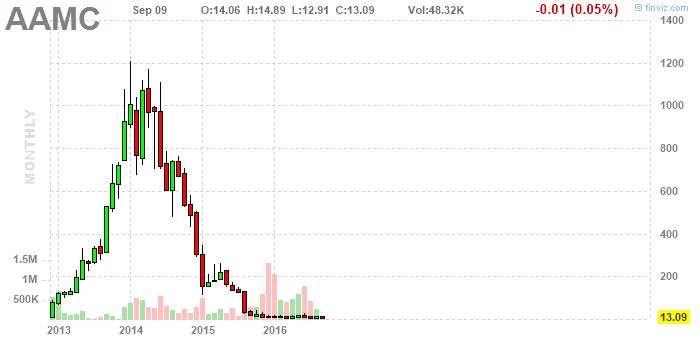
targets are $3, $30, $400. revenues are way down and tiny, losses are substantial, but, again, strong balance sheet and trading just above book. more resources from the chat room
 enjoyed the video from July ... looks like a good approach (and for a smaller account) to me ... expensive service, but ... if i had some cash, i'd go for it. Kavout ... i'm looking for faster action, but if you're looking for investments (vs trades), it seems to be set up specifically for that. and, at the moment, it's free, apparently. (of course i guess they'll get u later.) great splash screen photo.
Again, we've lost again and again with these low price stock. The pattern looks very good, but you might want to treat it as a test rather than buying.
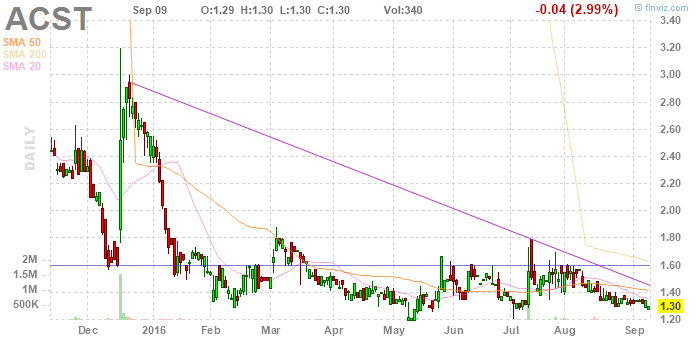
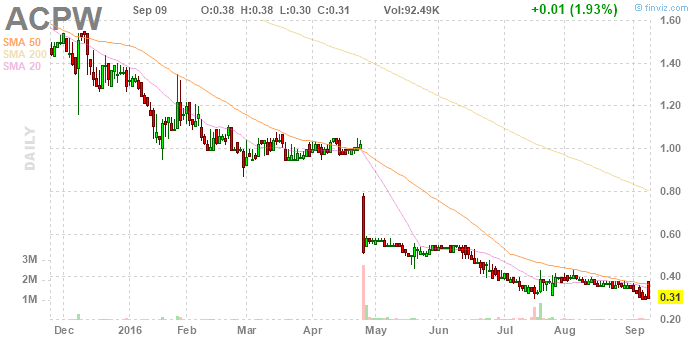
like this a lot. that doesn't mean u should, tho u could. so many losses in stocks that r down, but have also seen them go up ... a lot. i say it looks right. but someone on the chat board wondered if it would go bankrupt. revenues are down but not out, modest losses, and p/b is under 1 ... their balance sheet is strong looking to me. also, seems to me i looked at the company web site years back and liked it a lot. buying a small amount at the bottom of this red bar makes a lot of sense to me ... i'd qualify it as an opportunity. should positively jump to $1 now ... but if it does that, maybe it's headed for old highs again. maybe i'll buy $200 worth and sell half if it goes to $1. (there's also strong resistance at $4, so maybe i'll do $300, sell a third at $1, a third at $4.)
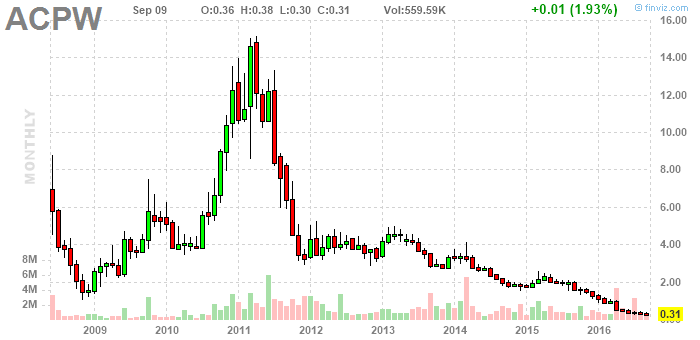
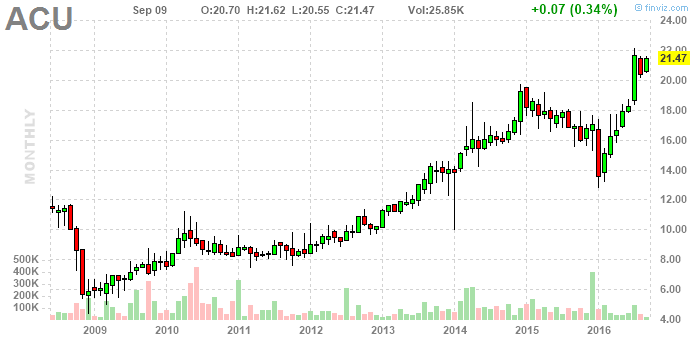
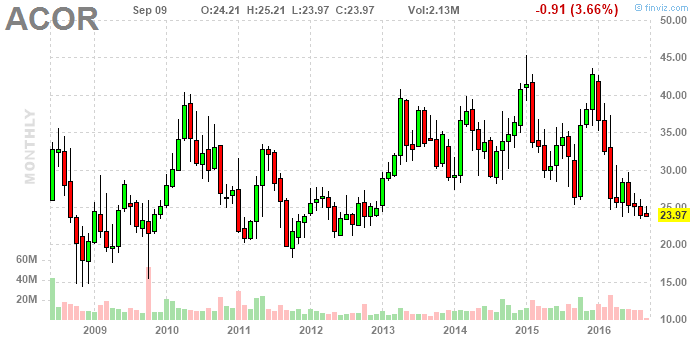
the monthly chart looks pretty solid to me. it's a decent size company and has made money consistently for several years. p/e is slightly high. total liabilities are about double (a bit above) current assets, but current ratio is very strong.
 Chart Mill thinks it's iffy and a little early. Bears are all over it. Is that a short term / intraday perspective?

 Ben1150 seems very adept, and helpful. A large account would be needed to trade his system, tho.
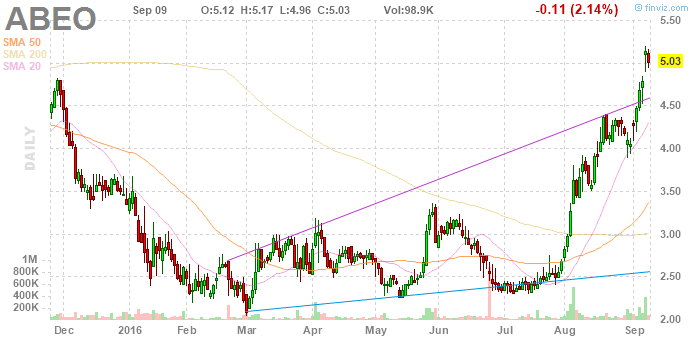
might be a smidge early for ABUS ... or not?
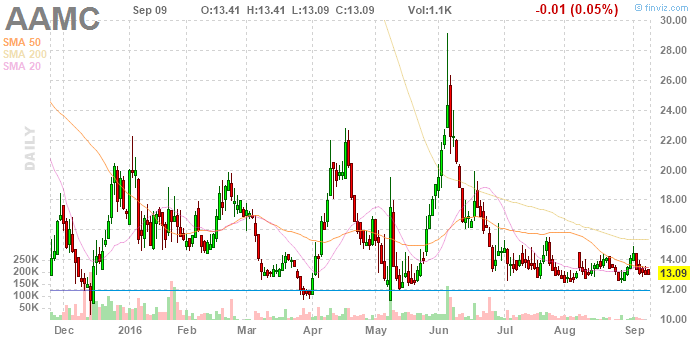
what to expect from AAMC?
Aoxin Tianli Group Inc. farm products, China, black pork, book value $2, p/e 4, reverse split 9/9/2016 f
No comments:
Post a Comment