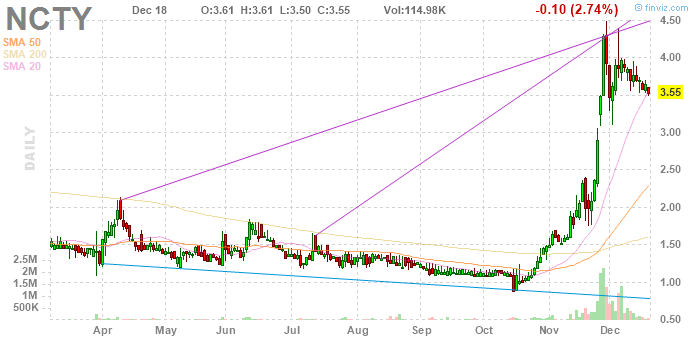
See the big red bar in mid October? What to say? It could have turned out to be a breakout down, with prices continuing lower ... to .5, to .25, to .125 ... approaching zero. But, it turned out to be a dip, and, as you would expect, it predicted a great rally. I think that's what dips do, and here's one dip doing it. Still ... well, it was big red bar big green bar. Is that a dip, or could it be a flukeish breakout down itself? Anyway, now we have dippish red bar and Red Green Flash, and what's the third bar? A Big Green I Hammer. After that, the price never went below the hammer head.
Seeing the above distinctive buying pattern, where would it have been reasonable to think it was headed? There was resistance between 1.50 and 2 from June and July, and at 2.10 from April, and then after that at at 4.50 from 2014 and 2013 tops. What happened at the lower levels? For one thing, it moved sort of slow until it got up there. At the levels, it just hesitated slightly. Once past the levels it went to the next level r fast ... and stopped there. Can you think of rules for distinguishing between the first type of resistance and the second? Anyway, it's obviously headed for 8 now, no?
I love this so much! I saved the chart a year ago, and I did a good job of that, because here I am looking at it again, and just at the right moment, because, for one thing, the new 1 year chart contains just a little of the action from the old one year chart, and, for another, it's now making a nice buying pattern.
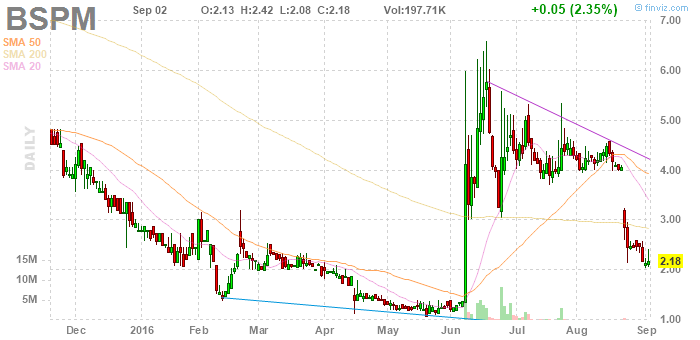
Mid February was a heel - and, incidentally, a dip and then a rally, so a red green flash - and then mid April was a heel, and then, actually, though it's hard to see, the beginning of May was a heel, and then mid May was a toe ... and, I would have been thinking "I have to buy it, but I'm not sure." Then it expanded, and three quarters through May it did a pick, and an inverse hammer ... and buying that, or the toe, would have been fine, but with a wait. Then June started with four small green bars consecutively, rising, and then the big rally. As for selling, the big rally was a big green bar with a big upper wick, and then, a few days later, it could be sold at the top of that long upper wick.
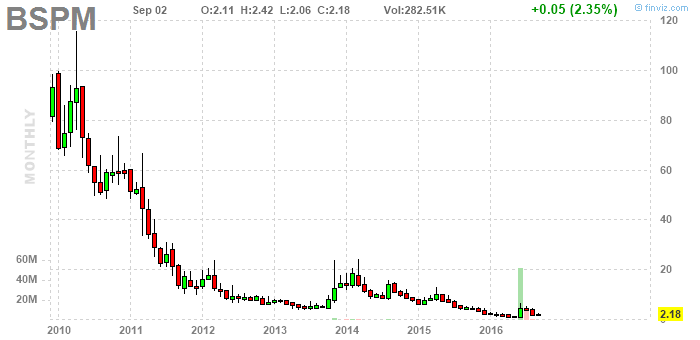
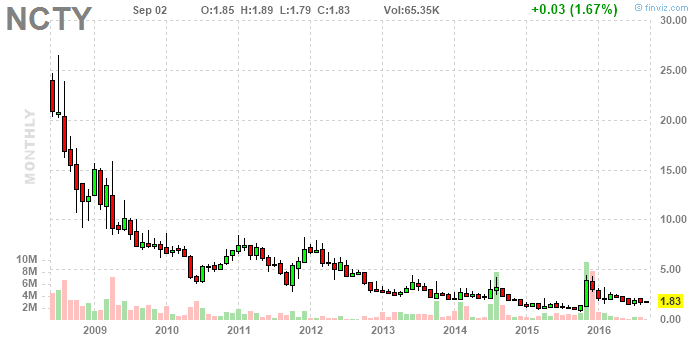
Seeing the heel three heel one year wedge, the toe, the expansion, the green bar run, what was the evidence for where it was going? Up, for sure. Come to think of it the target is the top of the wedge, and it did sort of stop there. The action above that was all long wicks. On the monthly you can see it stopped at the level of a not extremely prominent shelf from late 2015.
No comments:
Post a Comment