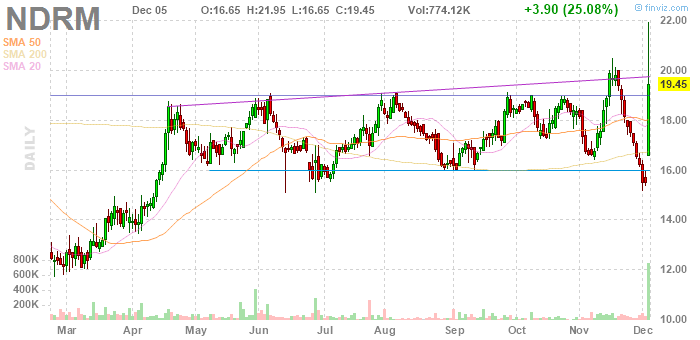
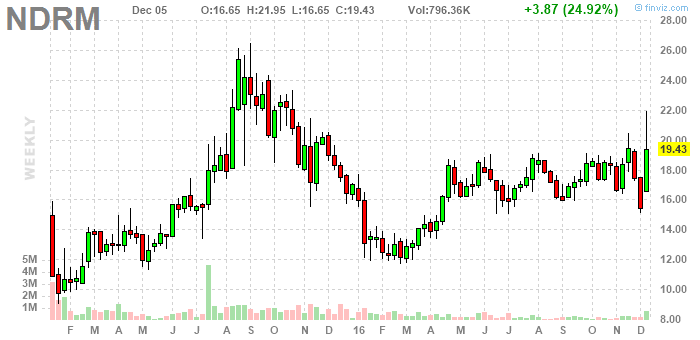
Interesting that there are three red bar sequences on the chart, with the first two producing decent but slow rallies and the third a dramatic rally. The first two were also erratic in form, while the third was very linear. That third red bar sequence also ended with a long bar followed by an enclosed bar. The enclosed bar would have been visible near the close and also earlier in the day (see five day chart). A scan for stocks down 20% in a month would have included this chart as the last red bar sequence moved into buying territory.
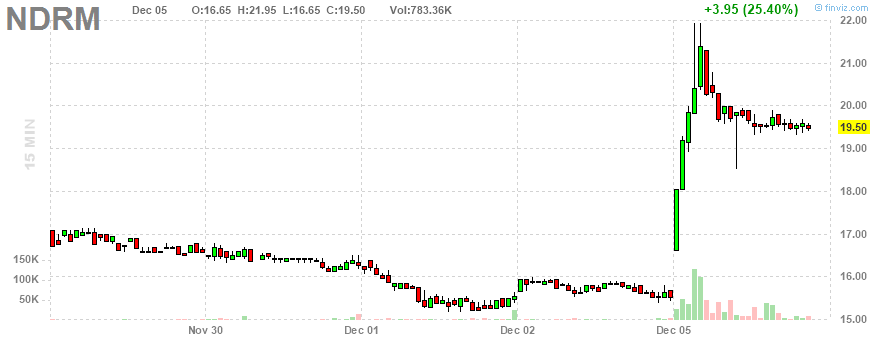
December 1 ended with a well formed head and shoulders (boat) in place. By mid day December 2 the price was back at deck level, and a stop below the keel would have been a reasonably close one. Prices were at deck level for an hour at the end of the day.
Some rapid action would have been required to buy 15 minutes into the day, with a stop below the low of the spinning top second bar, so, a decent stop.
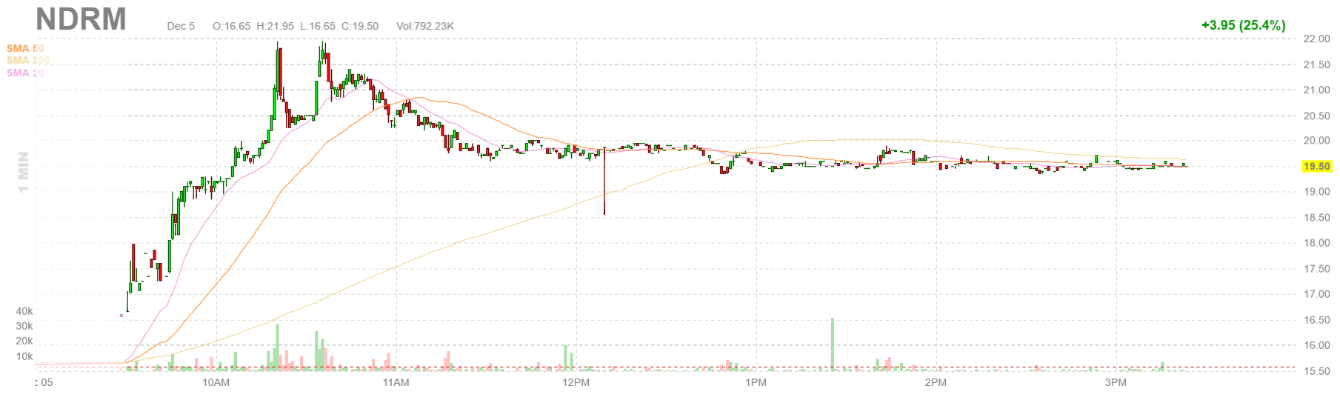
What it looked like on the one minute chart.
I'm inclined to expect a dip to 14 next. I don't think I'd want to treat the tail on today's action as a buy signal, although, if it gaps up in the morning maybe it'll go to 26.
No comments:
Post a Comment