maybe that was around 11:30. (9:30 here) i seem to remember thinking i should look for a breakout.
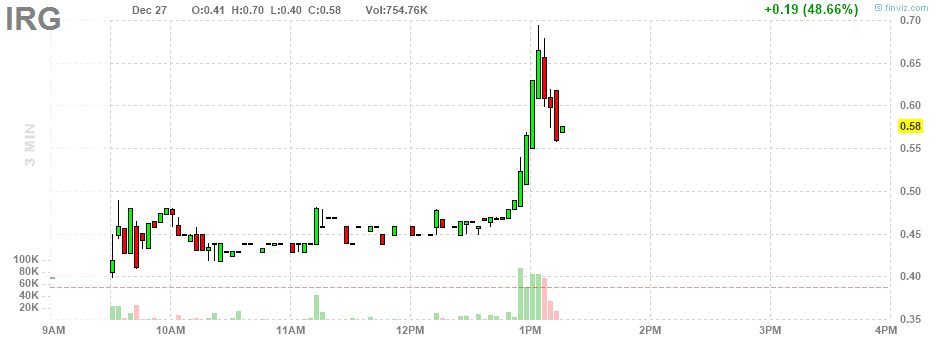
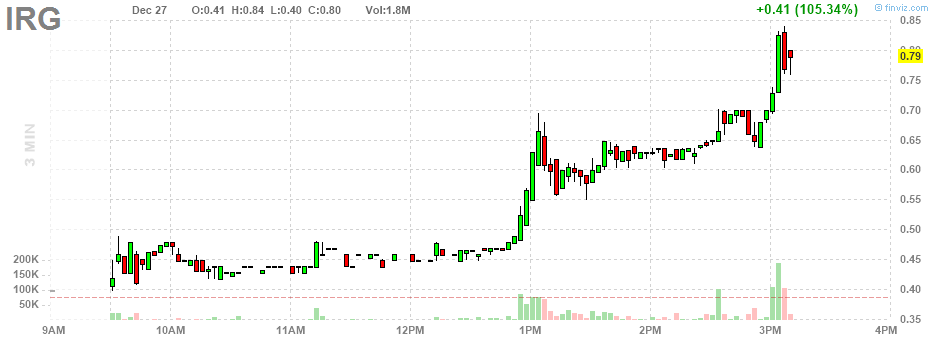
anyway, that most certainly was a breakout this morning. complete with fabulous flying inverted hammer.
well, i then got distracted. by the time i came back to it just now it had blasted off big time.
if i'd been watching from the opening bell, once that hammer was in place, i would have been (actually, really, although i'm still developing the discipline) watching for a breakout on a retracement. that came at around 10:30, in a small way, but at .43 after that would have been nice, and maybe possible, with a 2 cent stop, which is a 5% stop (which doesn't mean the risk is 5%, just that it's limited). would i have had the discipline to use a .43 limit?
it certainly broke out at 11:15, and an order at .44 after that might have been filled, and then it broke out at 12:15, and an order at .45 might have been filled, and then it broke out at 12:45, and that was really significant. i mean, we can see that in retrospect, but it was also then breaking out from a high pattern, where the previous breakouts were from low patterns. at that point, too, you had to buy at the market.

here we are a few minutes later, and elements of a top are in place. so we can consider the question of selling. well, the 1pm 3 minute bar was extended, so selling at its high would have made sense, though that's a difficult kind of decision to make. the next bar described a bit of slowing. that could have helped.
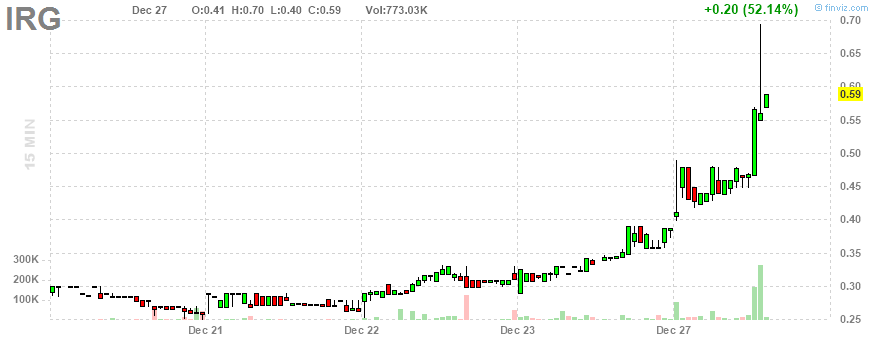
on the three minute chart, the pattern looked worrisome, once it pulled back under 60 cents, and even as it started to recover a little, but on the fifteen minute chart it actually looked solid to go back to .70. since i had that thought it has been rallying again.
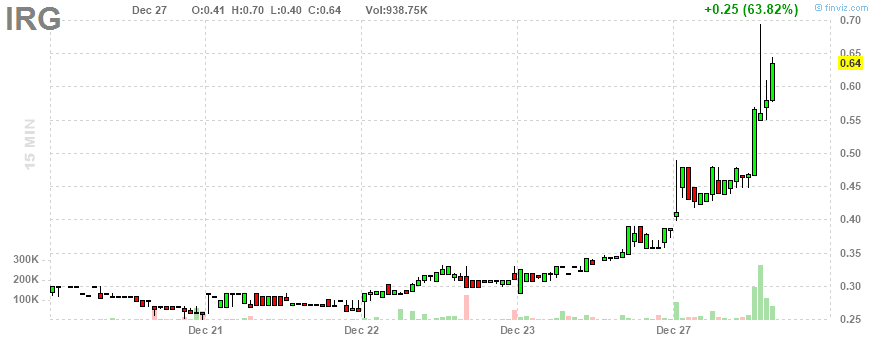
tempting to sell at .65, here. that's a good gain. (should sell at that price if i chose to do it).
hesitating, though. the inverted hammer, and then the way it's surging from .55 makes me think, first, that it's going to .7, and then it makes me think i should check the longer term for clues as to where this is headed.
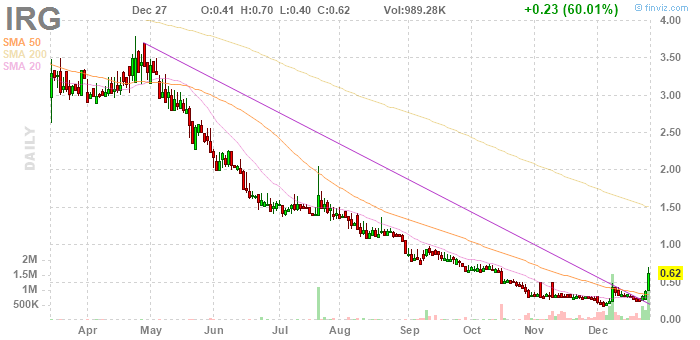
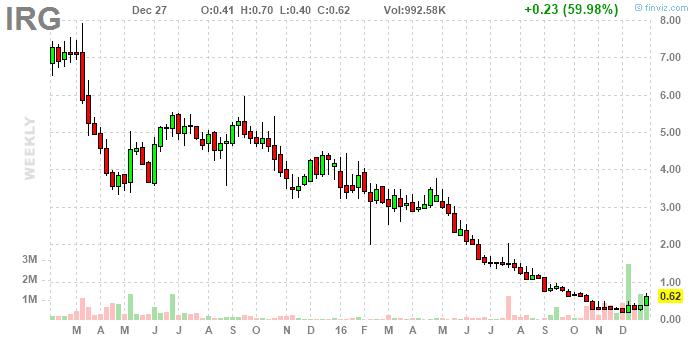
the weekly chart particularly makes me think this is not done. seriously considering holding it overnight. kind of expect another gap up tomorrow morning. even if it drops, i'll probably be able to sell it at .6 still, tomorrow afternoon, say.
Watchlist Notes
I found this this morning, looking at stocks up a bunch, so that's one way for sure, but it worries me a little. I mean, it shouldn't - this is great - but what if I could have had it on a top level watch list several days ago? On what basis? On the basis of its being a nice pick, and having returned to the top of early December's nifty boat shaped bottom ("deck","hull"). The question then is, if it was on an "extra watch" list, what was the actual buy signal, and the five day chart we have maybe just covers the relevant details.
It broke out, above tops, well, shelves, anyway, the morning of December 21, though not in a completely convincing fashion. True, the December 20 end of day lows, a nifty double bottom, turned out to be the reversal price, but what was there in the way of a stop? Was that nifty double bottom the stop? Then, first thing December 22 it sent down a scary tail to the stop level, but bounced right back, then broke out strongly through the middle of the day, then pulled back into nice horizontality, and even broke out at the close (which reminds me, I want to look for breakouts at the close as a way to pick trades for the next morning). But where was the stop then? Under the morning's action. But the morning of the 23rd, it shot down there. Still, it immediately began climbing.
All these signals, though, were neutral or even a bit negative, contextually. The first signal that was entirely positive was the solid green 15 minute bar mid day the 23rd. Really, it broke above all sorts of tops. The stop, at that point - and this is sort of a not to self, as much as saying I knew this - was any bottom, so, the low of the breakout bar, and even each subsequent low until the nest breakout, an hour or two later.
Finally, a nifty little base formed near the close, with a stop below the low of the day's second big green bar, and then the last bar broke out from that base, and the base held as a stop. We've already seen what happened today, after that.
Final Question
What about a target. What would I have been thinking about as that pick formed up on the daily chart? Well, the action of July and August was telling, and I would have noticed it. I'm not saying I would have said it was a certitude it was headed up there, or that I am saying it is now, but I would have thought it was a possibility ... and I still do.
back to trading

another buying pattern. is this setting up an afternoon rally? stop is .625. could move my stop up there on the earlier buys and be pretty happy (but, a little anxious ... i described the alternative already: wait until tomorrow to sell either way ... thus, now, not risking getting stopped out on a silly premature raised stop).
Notes on Trading
Let's say I had $2000 in cash available for trading. I want to use a close stop, so I might get stopped out any time, including with in minutes, and definitely within a couple of days, which would be before my purchase cleared, so I would have to have cash in the account to cover a sale - I've learned that the hard way. This means the maximum I can put into a trade of this sort is half the cash available for trading in my account, and if that's $1000, then the commission on a round turn represents 1.5% of risk, by itself. Add to that the risk in each trade, and we've been looking at 5% of risk, here, even with our very close stops.
This basically means, with a very small account, we have one shot at this kind trade. Either that or our commissions become an increasingly major factor, and our risk starts to creep up towards the 10 and 20% are, or higher.
I do feel good about the later analysis, presented here, where we were looking at breakouts on top of breakouts. (Does the last proposed buy qualify?)
setting up a buying pattern again.
No comments:
Post a Comment