 f y m
f y mFor entertainment purposes only. Not a recommendation to buy. The author is not currently trading and will not be taking a position in this stock unless otherwise noted.
Based on this chart I say APRI could produce a good day trade any day. It's possible that a particularly telling pattern will develop on the daily chart in the coming days, signalling a rally the next day, or that there will be a strong open one day, followed by a clear intraday buying pattern and a strong move through the rest of the day. A single day rally from the current price area to 6 is a possibility. An event of that sort would suggest the possibility of a continuation to 16 in very short order. A one day rally to 2 would also suggest the possibility of a continuation of that advance. Multi day rallies to 2 or 6 would suggest the possibility of a multi day retracement of those rallies, especially if they ended in extended bars.
Given that we are considering the possibility of a move of more than 100%, possibly considerably more, a very small position with no stop might be worth considering.
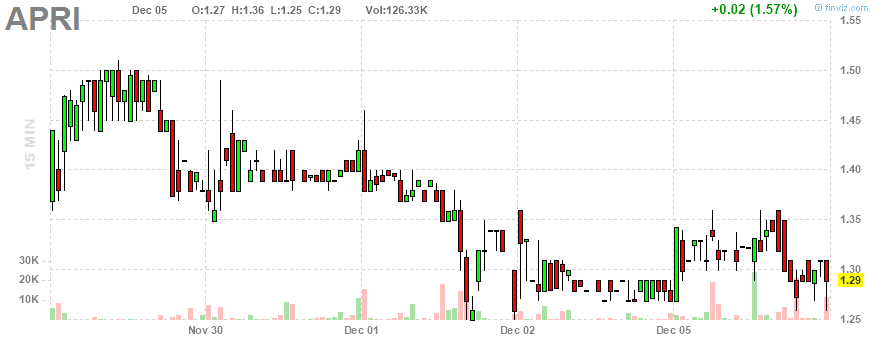
For trading with a stop, the present pattern on the five day chart has merit. It cannot be regarded as an especially high percentage bet, but a price of 1.26 tomorrow is a possibility, and an in the market stop at 1.24 might hold, if you're doing that kind of trading. Keep in mind that a gap down is possible. If you take this trade, you should regard the risk as being 50%, so a limited position is advised in any case.
get your sweetie something
No comments:
Post a Comment