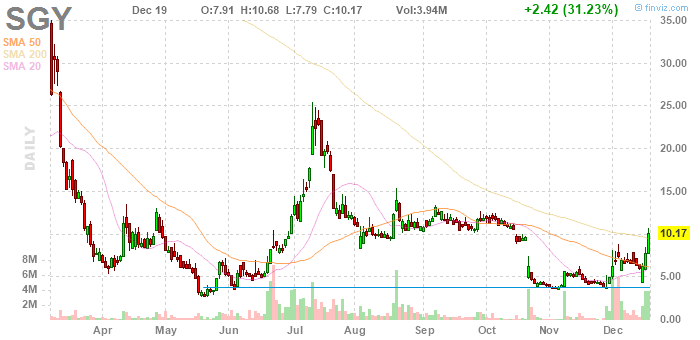
Towards the end of October it was a cliff and toe, the toe very pointy, and then a green bar. Turns out that was an early pattern.
At any rate, the one year wave was big and shapely, and energetic, too, that is, choppy. And now it was a return.
Also, it was down 50% in a month, so it would have shown up on that scan. At the end of November it would have shown up on the down 50% in a quarter scan.
The financial statements are a bit nightmarish. The only positive is decent size revenues, $500M, and even that is trending downward over five years. They were making money several years back, but are now running huge losses. Trading volume has been pretty good, as you can see, and at a decent price.
The mid November cascade returned prices to the brim of the early November cup, and the footrim of the cup ultimately held as a stop, but a shelf formed. That shelf ended in a dipping red bar, and that, as dipping red bars often are (but it's so hard!) was the ideal buying moment ... with its end of day low being the ideal buying price, filling the next morning. That next day was the inverted hammer signal, a classic example ... but it would have had to be bought at the end of the day. By the open of the day before that it was up, and the footrim stop was already much less attractive.
The November pattern's fractal echo of the year's pattern could have added weight to the signal ... if you could have seen it then.
Now the question is whether to sell it here. A double is in the bag, and pretty quick. It's stretching out. Will it go to the mid year high again, and soon enough? Probably. Will it retest the pattern bottom first? Probably, but getting back in , let's say under $5, let's say having sold here, above $10, could be tricky.
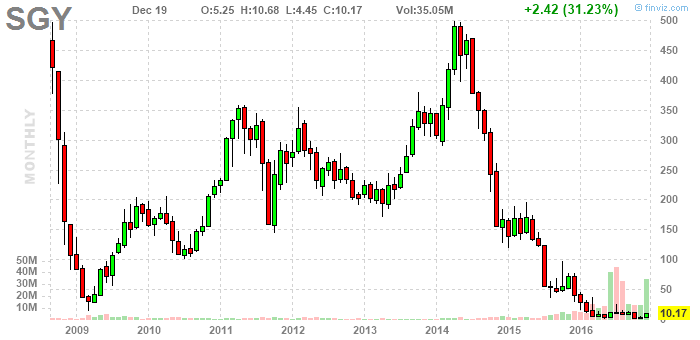
A conservative strategy would be to buy and hold for a return to 500. Might be really hard to stomach, though. Feels like the developing bottom needs more months of work, and meanwhile there are prominent tops at $25 - the mid year top on the daily chart -, $100, $200, each of which, really, seems like to turn prices back towards the pattern bottom. Factoring in the hairy fundamentals, it makes me want to trade it, not hold it ... but could I pull that off?
Here's the updater:
No comments:
Post a Comment