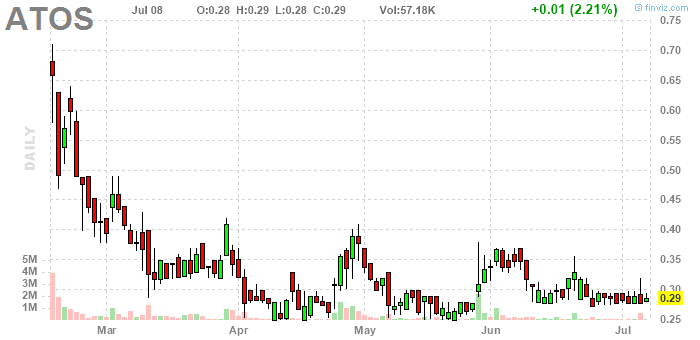
 order in limit .29, 3000s, aon
wow, what a dumb chart. had to go to Yahoo to get the actual price.
 f y
f y
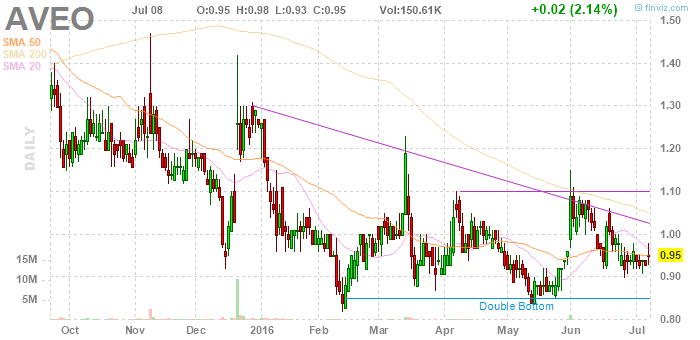
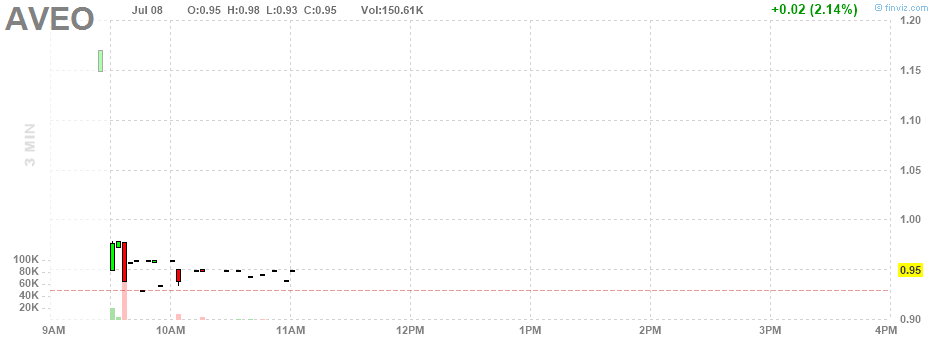
order in at .95, 1000s aon
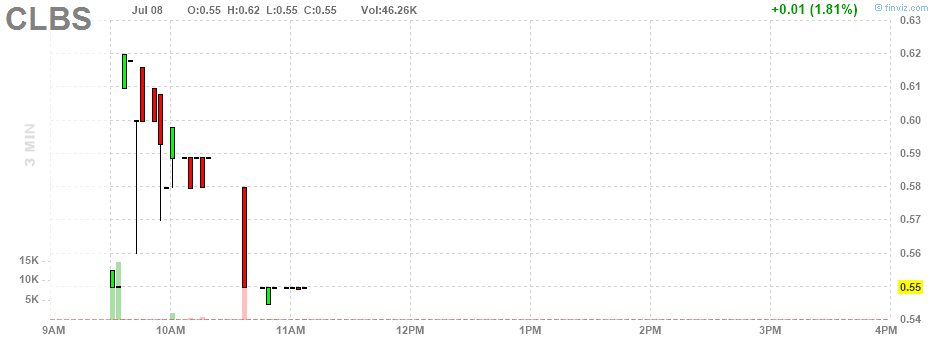
so, my order was in at .55, on paper, and it got filled, arguably, around 11:40
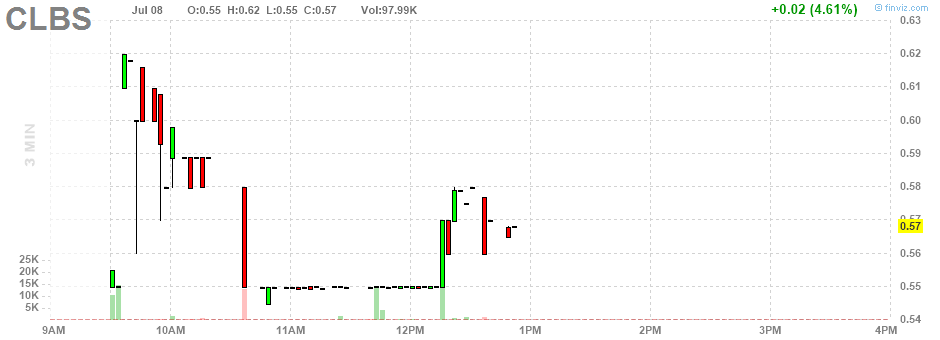
i wonder if i should be selling, here, i mean, at .58, because one approach is to place a sell order at the price marked by a prominent top. .58 would be about a $50 gain on my 2000 share purchase. ok, for one thing, i'm paper trading so i can learn stuff, and i'm not saying i know what to do, here. but there is this: the one year chart suggests this is the beginning of something. seems like i might have gotten in at an opportune moment. but this implies i'm looking for a stop, which opens up a whole new can of worms. what to do? what to do? what to think?
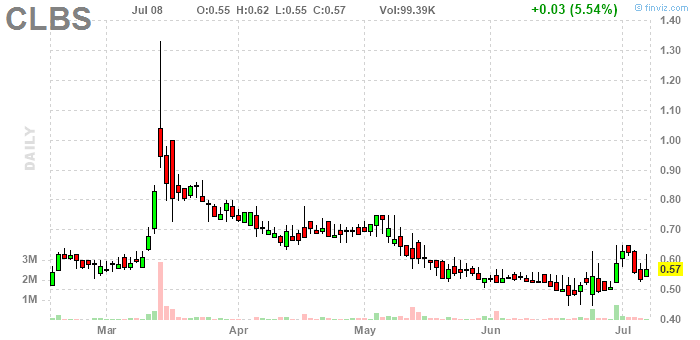
so, it definitely broke out of a point, the last day of June ... made a higher high ... and it's a big wave. the cool thing was, it jumped up first thing in the morning, then pulled back, and that's when I decided to get in. anyway, the top at the beginning of the months looks like .65. i wonder if it'll go up there this afternoon. well, if it does that, it kind of looks good for a rally Monday ... very iffy to make that kind of prediction, but ... kind of looks like that ... and .9 is a logical target.
No comments:
Post a Comment