
my prediction is that this is going to go to 28 in a few weeks
i also predict it will not again go below 18, before it goes to 28
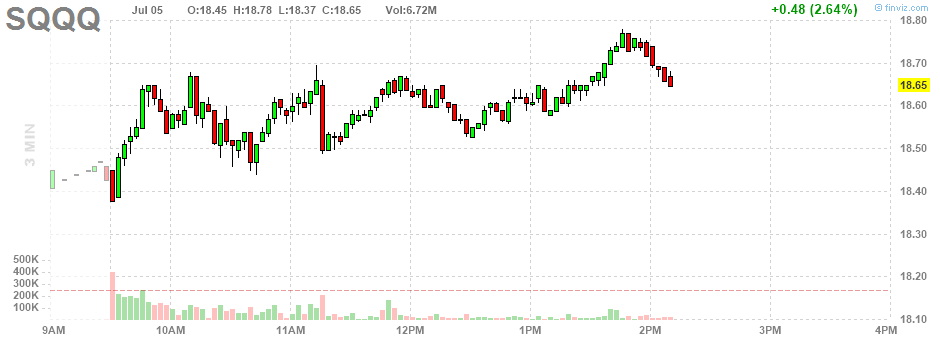
this looks like a good time to buy it
struggling to think about stops, though
a stop below any of the bottoms in this chart would make sense
a stop below the 1:10pm bottom would be a very very close stop
but, i'm thinking, even as good as this looks, i'll get stopped out
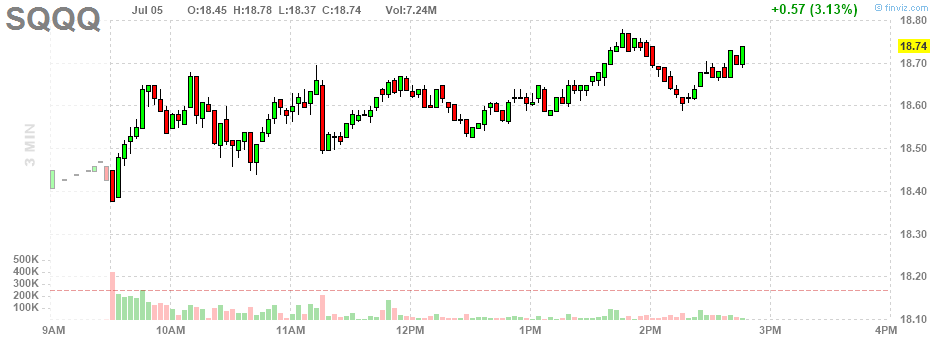
great looking cascade since 1:55, though
it has made a bottom:
doesn't look half bad

starting to look sort of locked in
i'm "buying" (it's a paper trade) a cascade bottom
a cascade is all those red bars in a row
and it has made a bottom
i'm buying a cascade bottom on the daily bar chart
at the top of the page
(it's not officially a bottom until the end of today)
and now i'm buying a cascade bottom on the intraday
one day
three minute bar chart
too!
and look at this
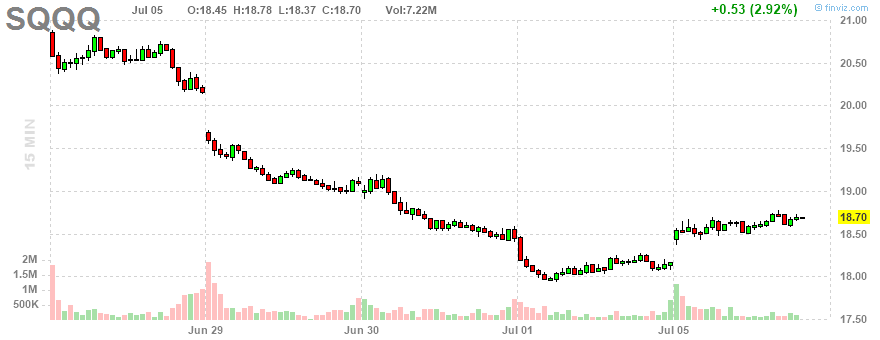
it bounced off the cascade low
on the 15 minute chart
(5 days, 15 minute bars)
gapped up, even
and now is building a shelf
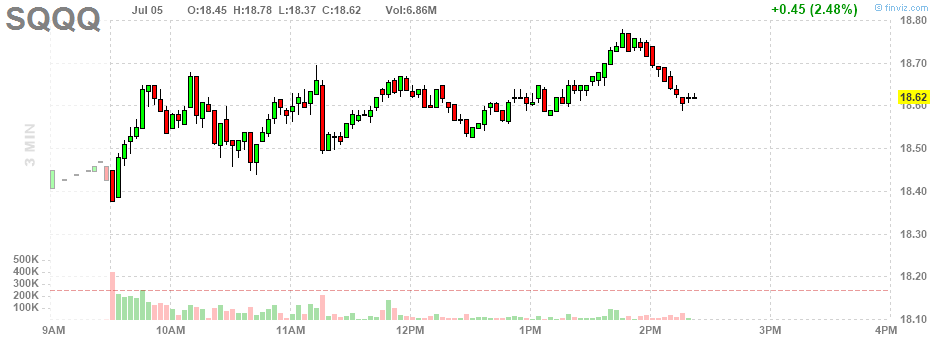
and, on the three minute chart
it bounced off the cascade low, and is building a shelf
don't know if this means anything
but it is the kind of setup i've been looking for
 wouldn't surprise me to see a dip
No comments:
Post a Comment