XRA 201411224-2015samedate: full year wedge down with new low (by a hair):
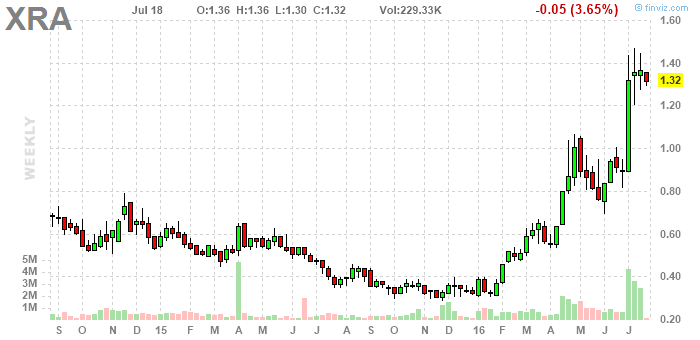
Scan 1: new 52 week low. Scan 2: down 20% in one month. Looking for, then, particularly telling patterns over the final few days.
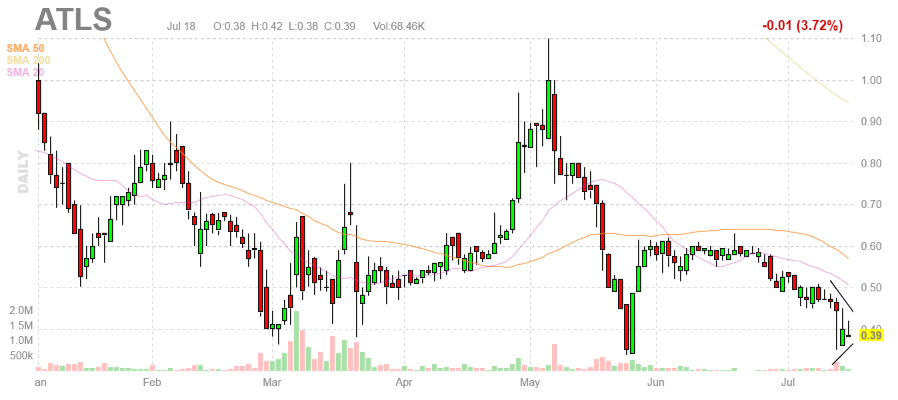
ATLS. I guess this is just headed for a dollar, short term. The concluding pattern, the last 3 bars, so distinct, it probably foretells a longer term rally, but I have my doubts that will unfold all at once. The fundamentals suck.
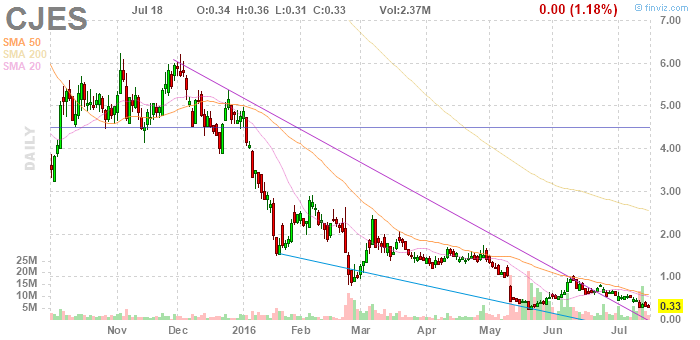
CJES. Actually, we need to wait for a green bar breaking out. The concluding (micro) pattern isn't enough, although ... it's close ... given the context. It says sales are 1.62B (and a 1.2B loss, go figure) and that the p/b is .18. I couldn't get a full report, though.
No comments:
Post a Comment