

I'm thinking it gaps up in the morning, then settles back to 3.30, then rallies to ... I'm gonna say 8, in a day or two ... slows there but continues to 10? Even then, there's a big top is at 16. For the updater, how about this weekly chart?:
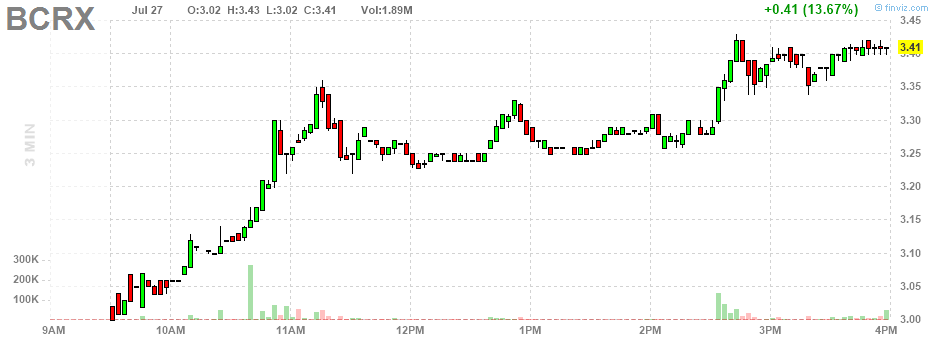
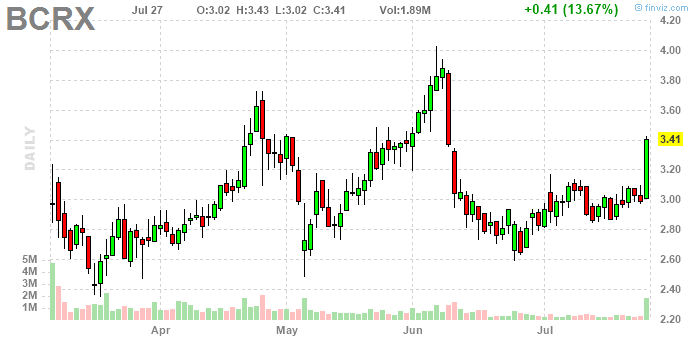
On the 5 day chart is shows it gapped up at the open, then dipped back to 3 - Tuesday's close. Took me a couple of looks to figure this out, but the first three minute bar was red ... that's the high open and the dip back. It broke above the first green 3 minute bar, nicely, and then a buy at that green bar high with a stop below the green bar low would have been a nifty trade, huh? Oh, and on the five day chart there was a heel in the morning and then it was going sideways nicely just above the heel low ... into the close. Oh, and on the daily chart, how could we have spotted this? I mean, it's overthinking, but, let's ask. OK, it was Month +10%, Quarter -20%, with a short inverse hammer Tuesday.
No comments:
Post a Comment