
linear decline beginning in April, heel, late in July. buying patterns - little green bars, long red bars with short real bodies, long red bars, for that matter - in early August, into mid August, and even the penultimate low - green bar with a short real body, after a big red bar - and, finally, a higher bottom and a short green bar. it's the linear decline that made this a kind of cert - i would definitely have expected it to do something just like this. this is now over, and we would be selling at whatever price we can get Monday. (The rally was on a Friday.) Well, actually, we can probably get 9.50. the down 50% in a year scan would have included this at the critical moment.
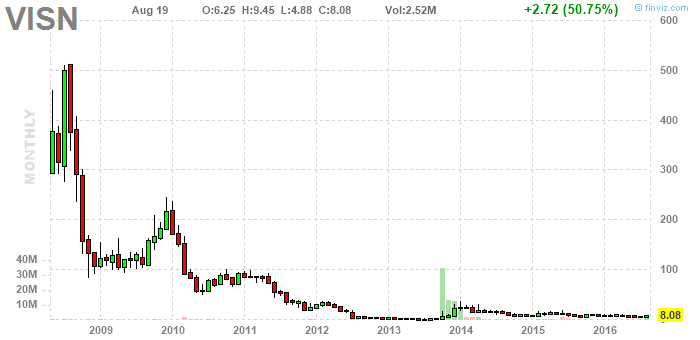
no question, this kind of hairy chart can produce trades. really, i like it long term, too, and not just a little, but here it has jumped 50% and now i think it's a sell, for your small account. and this whole event is next to invisible on the long term chart.
No comments:
Post a Comment