
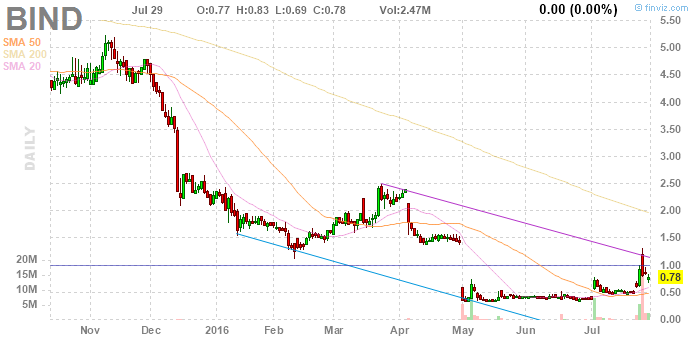
What was I thinking?
 click it
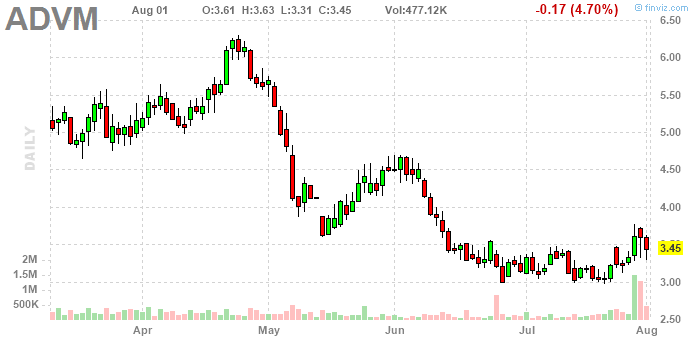
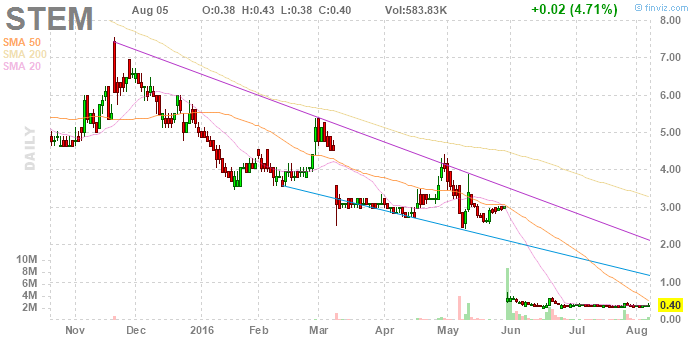
Three days in, ~$4.95 high ... to sell or not (
 ). 1st thought, intraday it's like a buying pattern. Upon consideration, today's bar is clearly up. Looking at the longer term context, 10 makes plenty of sense. 17 and 20, actually, also. f8-5:
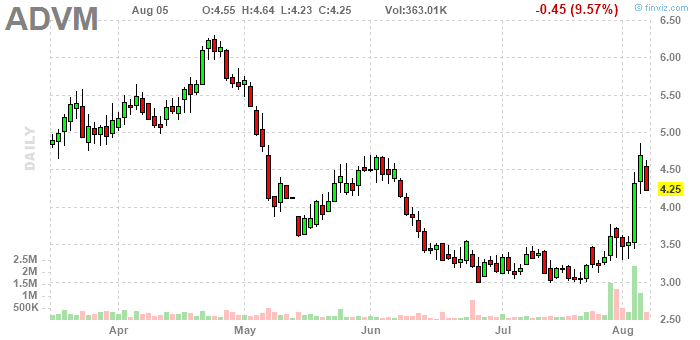
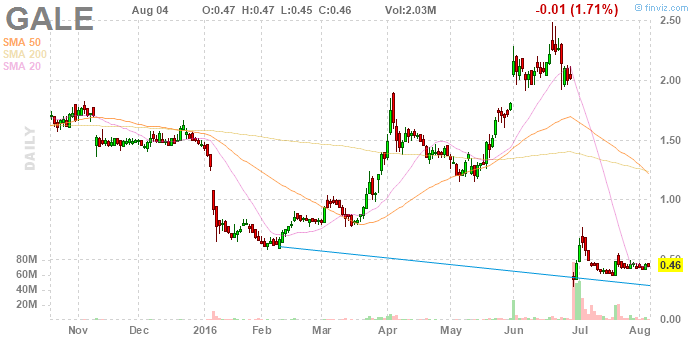
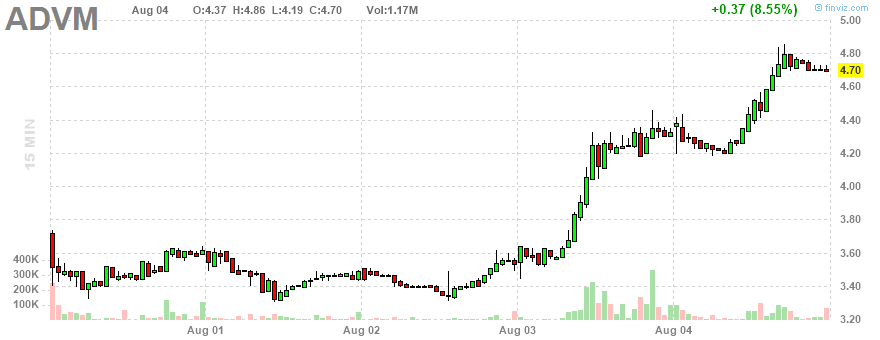
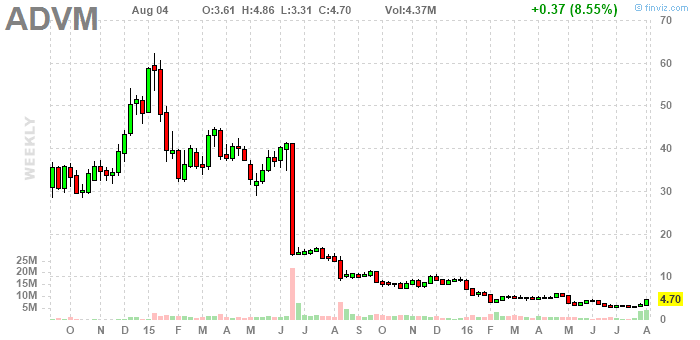
 Had to think about it, but, no, not selling. On the 5 day it's a dramatic buying pattern. (On the daily it's sort of a head-scratcher ... but isn't it about to break out, vs the June top? And even if it dips, I'm not actually worried.)
No comments:
Post a Comment