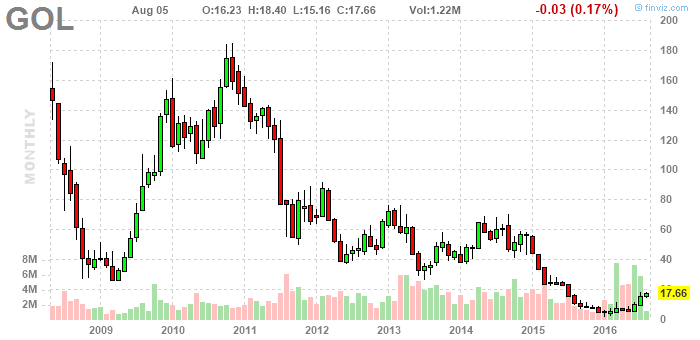
Remember GOL? When was I looking at it? Early 2015?
Late 2015 the chart would have interested me again.
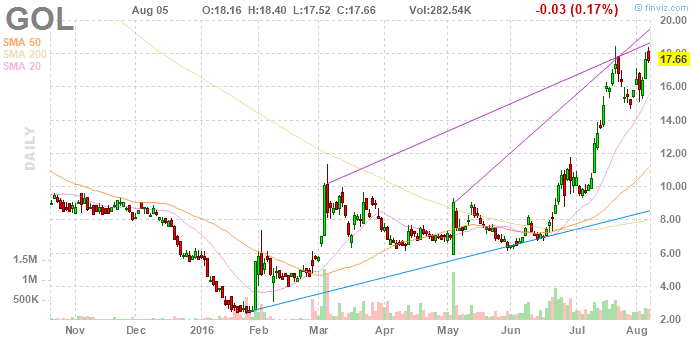 Of course I may just be dreaming, but I say the pattern it made at the ultimate low in January was distinctive and recognizeable. I say it was different in a meaningful way from, jut to take the available example here, the late December pattern.
It's a very big company. In that regard it's different from those losers you remember so acutely. And, given that there isn't much else to go on (other than that it's romantic) - growing and large losses, massive debt, short on cash - the chart shows that at the right price even such a mess of a company can produce a big rally in the stock. Headed for 60 is my assessment.
No comments:
Post a Comment